LabPlot 2.11 released
Say hello to LabPlot 2.11! This brand new release comes with many new features, improvements and performance enhancements in several areas, as well as support for more data formats and visualisation types. The main new features are outlined below. For a more detailed overview of…
LabPlot 2.10.1 released
Today we are announcing the availability of the minor patch release 2.10.1. This release contains minor improvements and bug fixes only. The fixes are distributed over many different areas of the application and we recommend everybody update to this patch release which is available from…
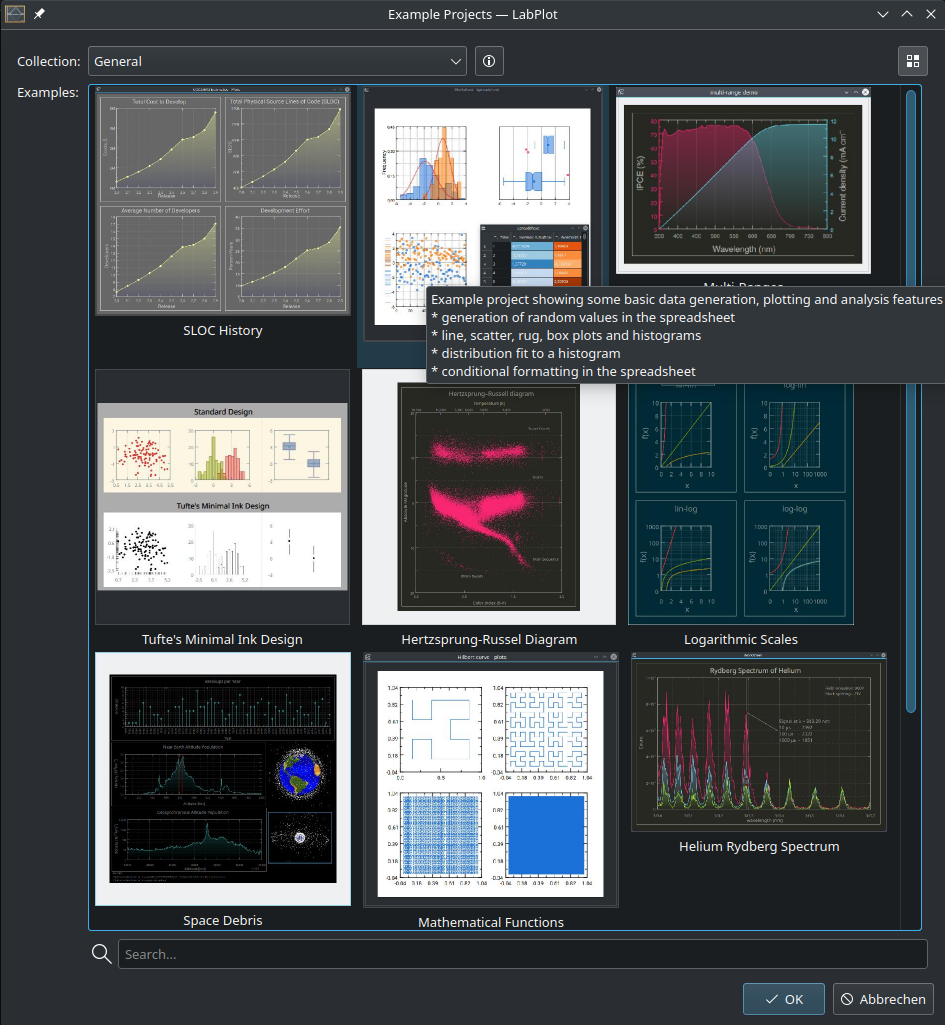
Example Projects
In the face of a growing feature set in any project, getting started becomes harder and harder for new users. This problem is common for many software applications, and LabPlot is no exception. To overcome this problem we’re investing more resources into creating documentation in…
LabPlot 2.9 Beta
After a long silence from us, we are happy to announce the start of the beta phase for the upcoming LabPlot 2.9 release. Over the past weeks, we have spent a significant amount of time fixing the outstanding issues and polishing new features. Some of…
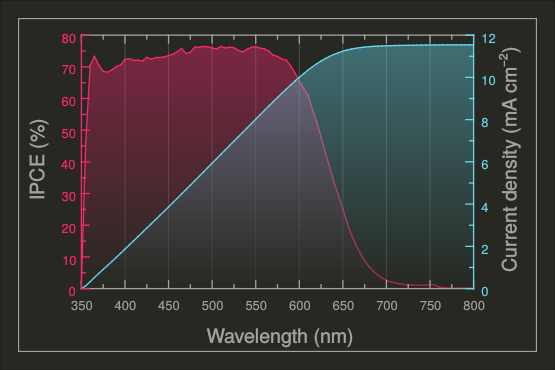
Multi-Axes Made Easy
Today we want to introduce the last of the new features we are implementing into the 2.9 release which we have recently finalized. To demo this new feature, let’s use an example contributed by one of our users. This example is based upon the measurement…
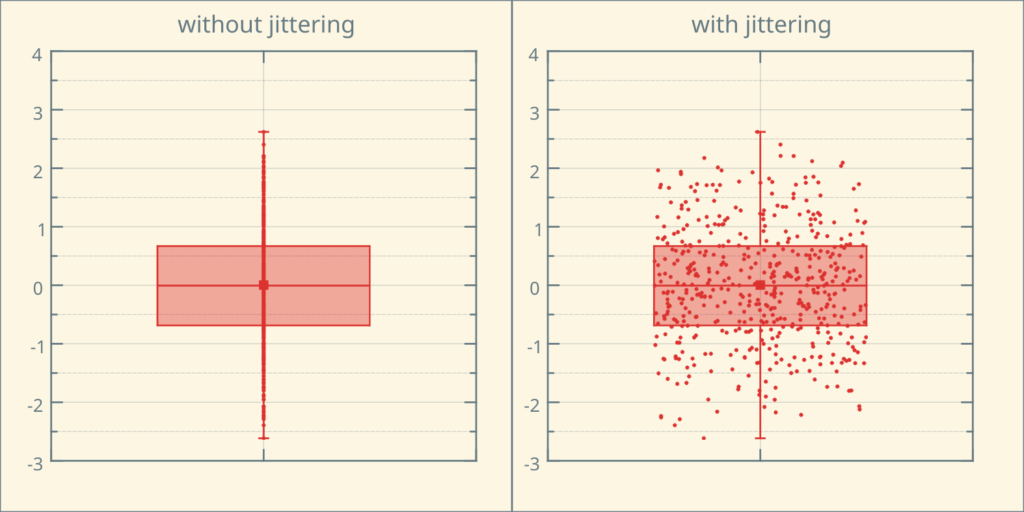
Box Plot
In one of our previous blog posts we wrote about the new development in the spreadsheet and the extension in the statistics dialog that now make use of new visualization elements. One of these elements is the Box Plot: Of course, this new visualization type…
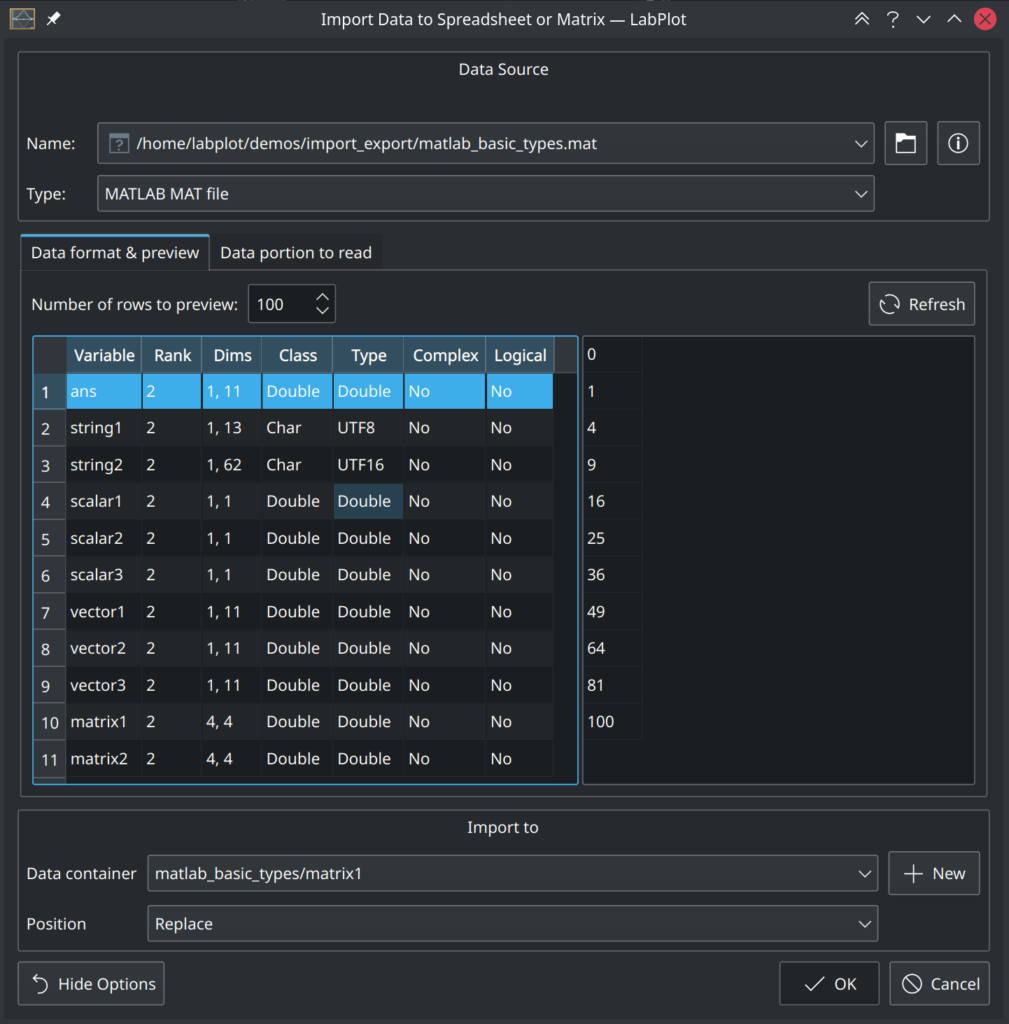
MATLAB, SAS, Stata and SPSS files in LabPlot
The analysis and the visualization of data normally starts with the data itself. Though it is possible to create the data directly in LabPlot, in many cases it will be coming from an external sources. For an application like LabPlot, it is essential to support…
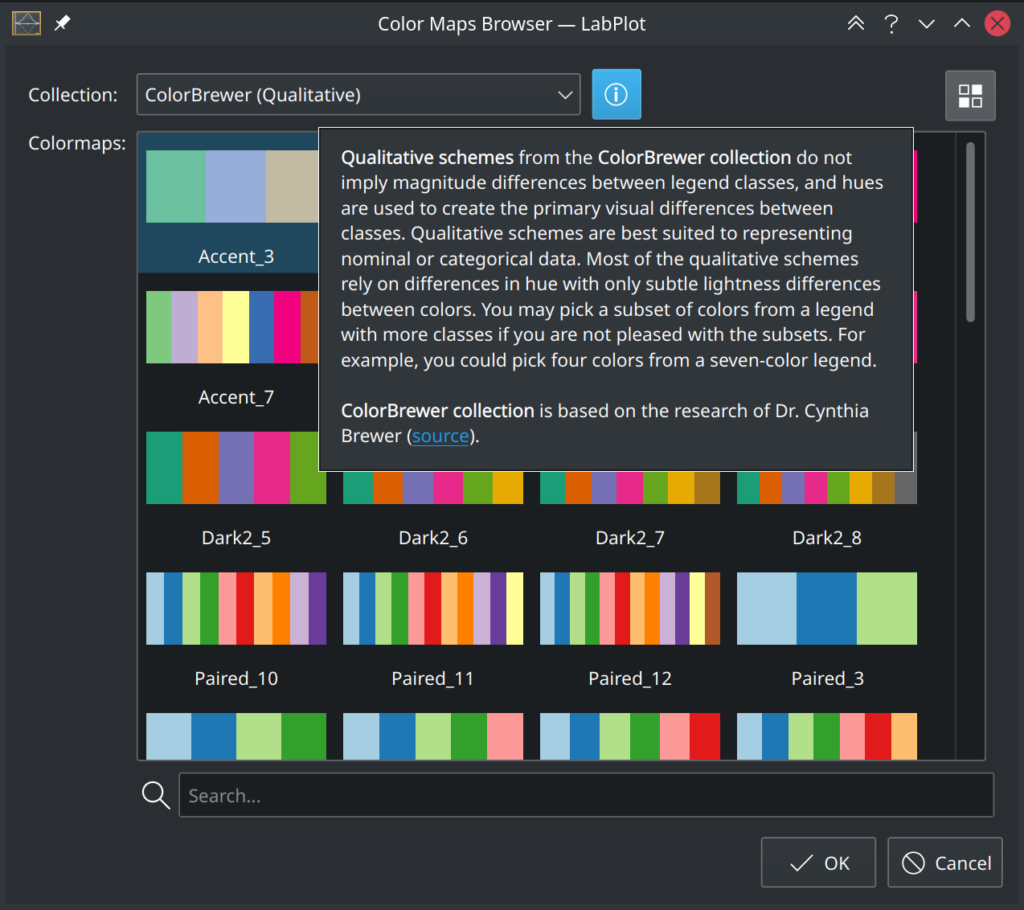
Color Maps and Conditional Formatting
When visualizing the data, mapping of values to colors is one of essential steps. There is an extensive discussion in the literature about the proper selection of colors (see e.g. the publications mentioned here), and there are multiple publicly available collections of color maps that…
Hilbert Transform
The next release 2.9 will again come with many very useful and interesting new features. Today we want to talk about a new feature in the area of the data analysis that has been included into LabPlot’s master branch recently. Though it is possible in…
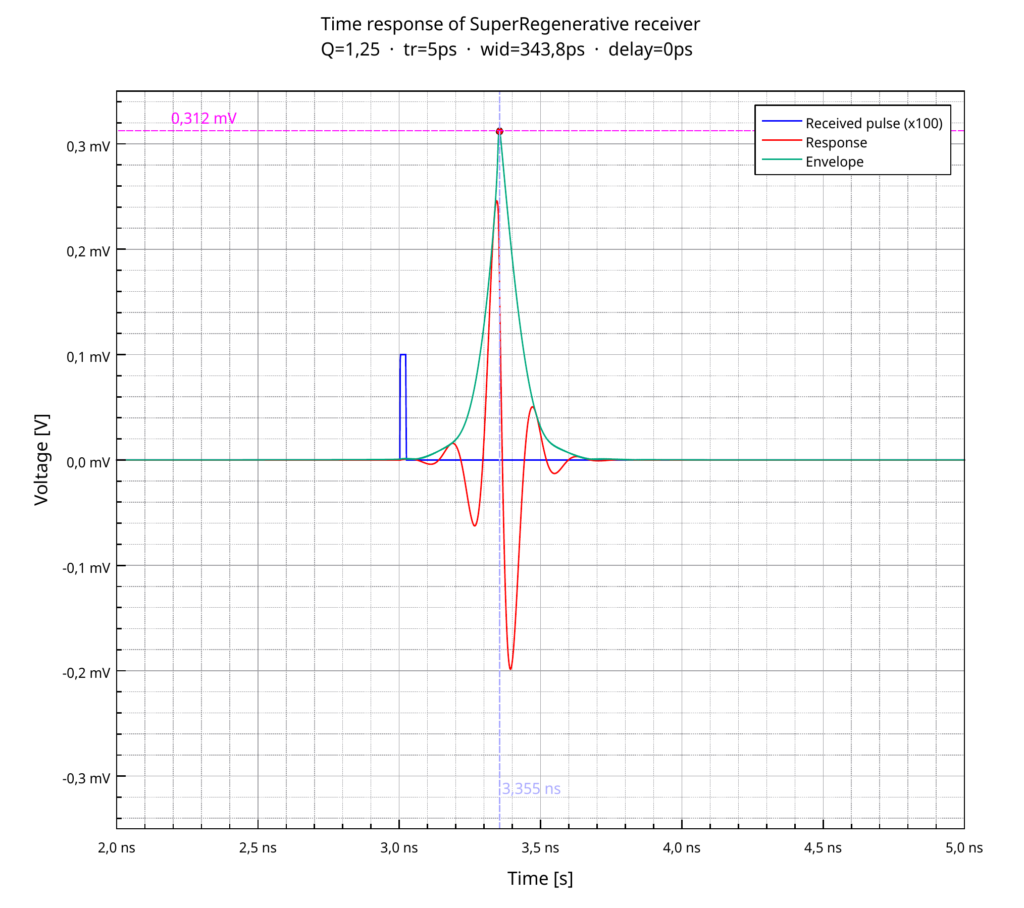
LabPlot 2.8.2 released
We’re happy to announce the availability of the next minor patch release for 2.8. Similar to the previous patch release, this release again contains multiple bug fixes and small new features and improvements only. As usual, the full list of the relevant changes is available…