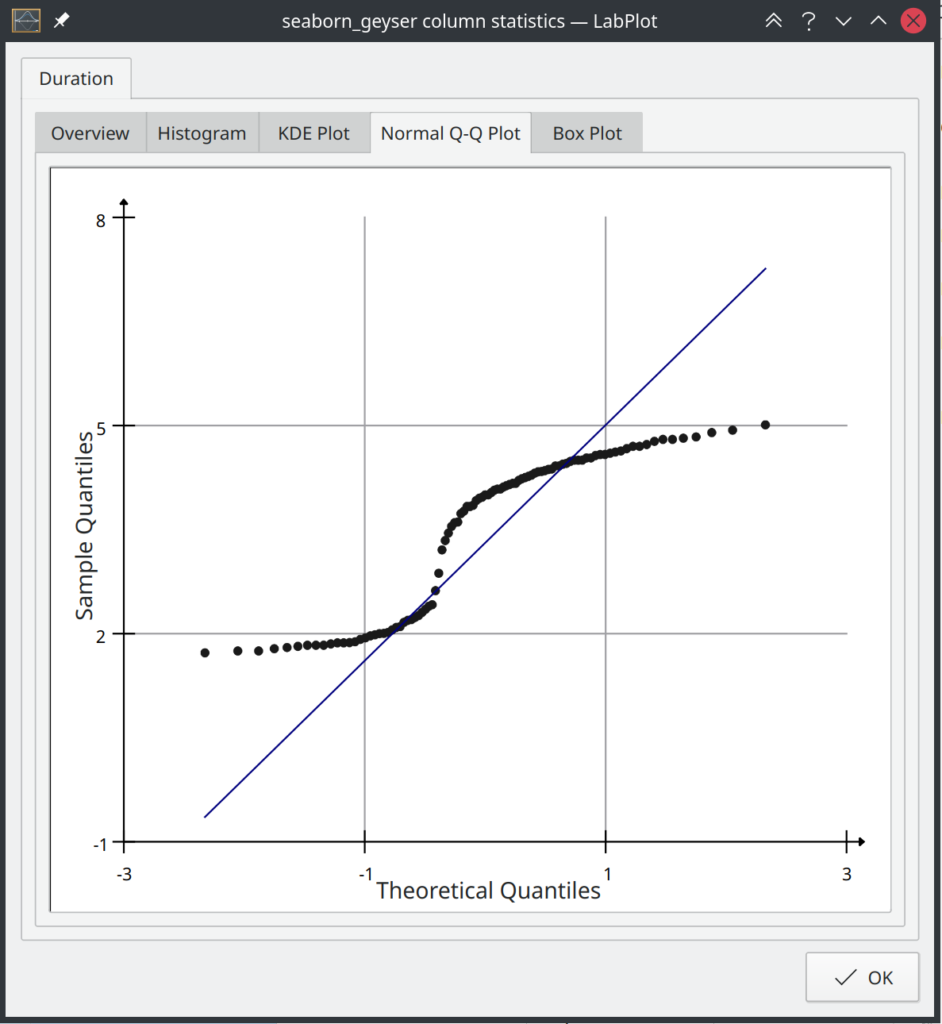
More Statistics
Right now the feature set of LabPlot that can be used for the statistical analysis is very limited – we only show some values from the descriptive statistics for the selected data set in the spreadsheet. While we’re thinking about which features to add and…
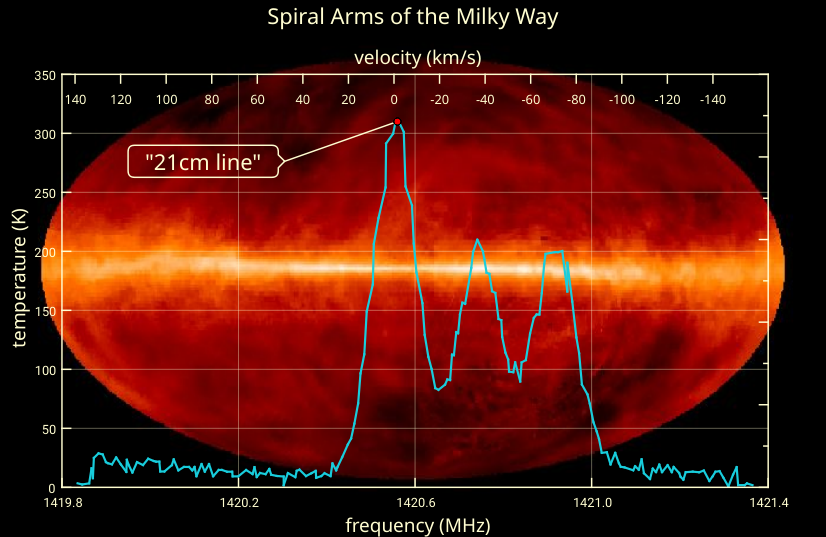
The Universe full of hydrogen and … a new feature in LabPlot
The Universe is full of the hydrogen and one of its emission lines that is very important in astronomy is caused by the hyper-fine interaction. This electromagnetic radiation has the frequency of ca. 1420.4 MHz which corresponds to the vacuum wavelength of ca. 21cm. Observations…
LabPlot 2.8.1 released
We’re happy to announce the availability of the first minor patch release of the big release we made two months ago. This release contains minor improvements and bug fixes only. In the plot we now allow to change the background color for axis labels. This…
LabPlot 2.8 Released
After almost a year’s work and a month in beta, we’re happy to announce the availability of the next release of LabPlot: version 2.8 is at last here. In this release announcement we will highlight the most important new features, so be prepared for a…
LabPlot 2.8 Beta
In the last couple of days we’ve got a lot of feedback and bug reports from our users testing the current code and helping us to finalize the next release of LabPlot. Most of this feedback is addressed now and today we’d like to invite…
Recent developments for the coming release
Despite a very active development in the recent couple of weeks, we still need to finalize a couple of things before we can do the release for version 2.8. While going through the remaining issues, we found some time to work on users’ suggestions, test…
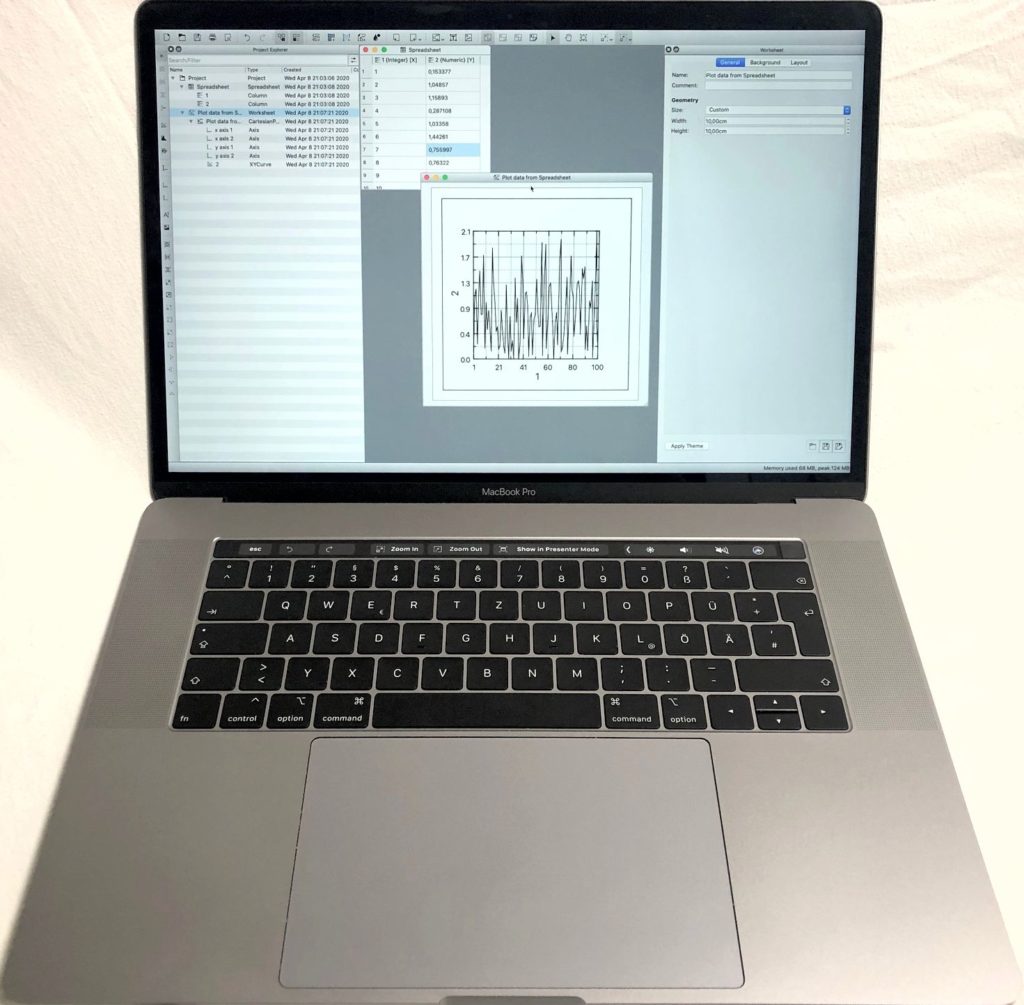
Touch Bar on Mac
MacBook Pro models from 2016 (4th generation) and later come with a touch bar, an OLED touchscreen strip that replaces the function keys and provides also the place for the fingerprint sensor. This strip is placed above the usual keyboard and, unlike the function keys…
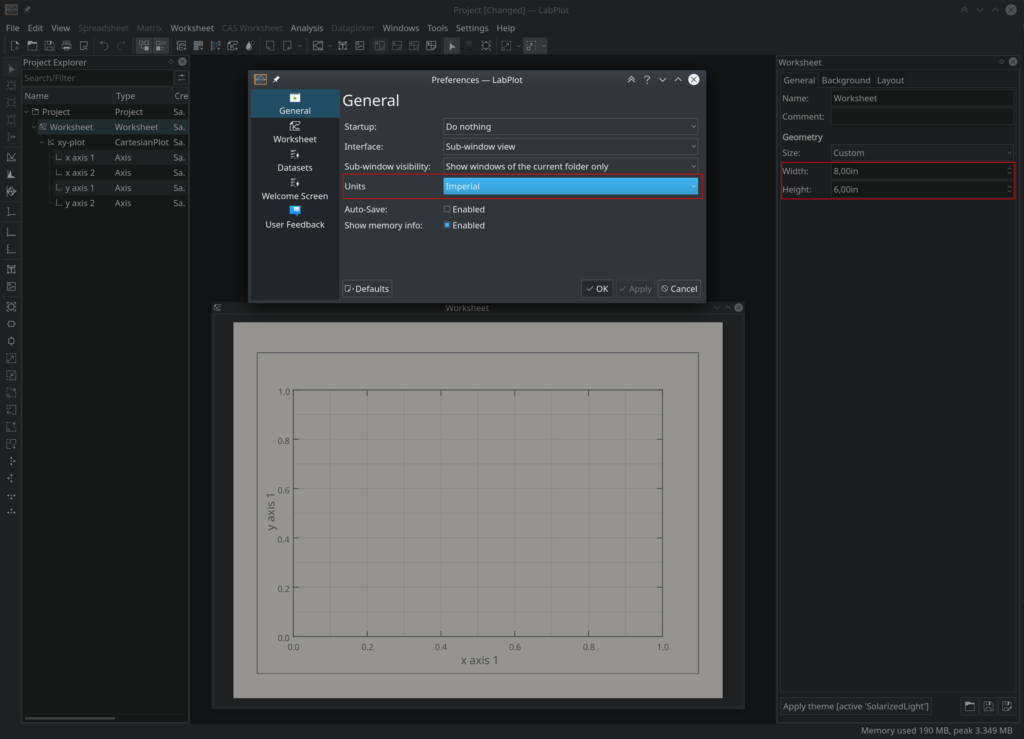
Imperial Units
This is another short update on the activities for the upcoming 2.8 release. While we are currently busy finalizing the last new feature (we’ll blog about this soon), stabilizing the new code of the new release and fixing bugs, there is still some time left…
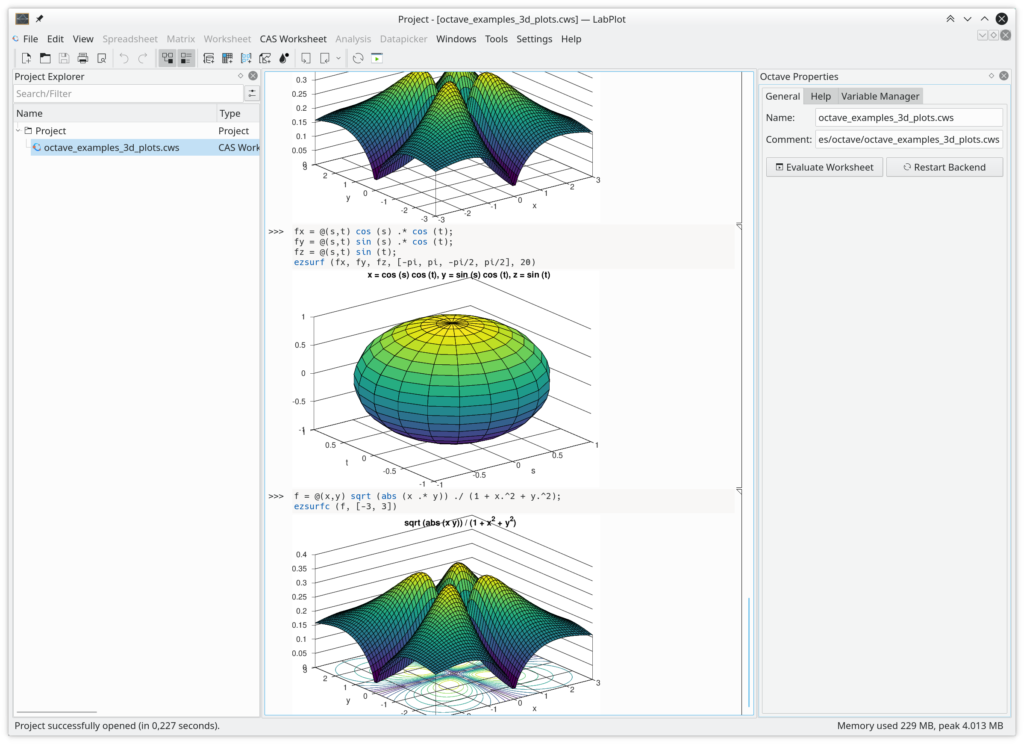
Jupyter and Cantor Projects
Jupyter project files In the recent release of Cantor – KDE Frontend to mathematical applications – the support for Jupyter notebook format was announced. To cite from Cantor’s release announcement: Jupyter is a a very popular open-source web-based application that provides an interactive environment for…
Reference lines and image elements
We continue working on the plotting capabilities of LabPlot. In the next release we will be adding two new worksheet objects to provide more flexibility and features to create attractive looking visualizations. In this short blog post we want to report on this recent development….