Touch Bar on Mac
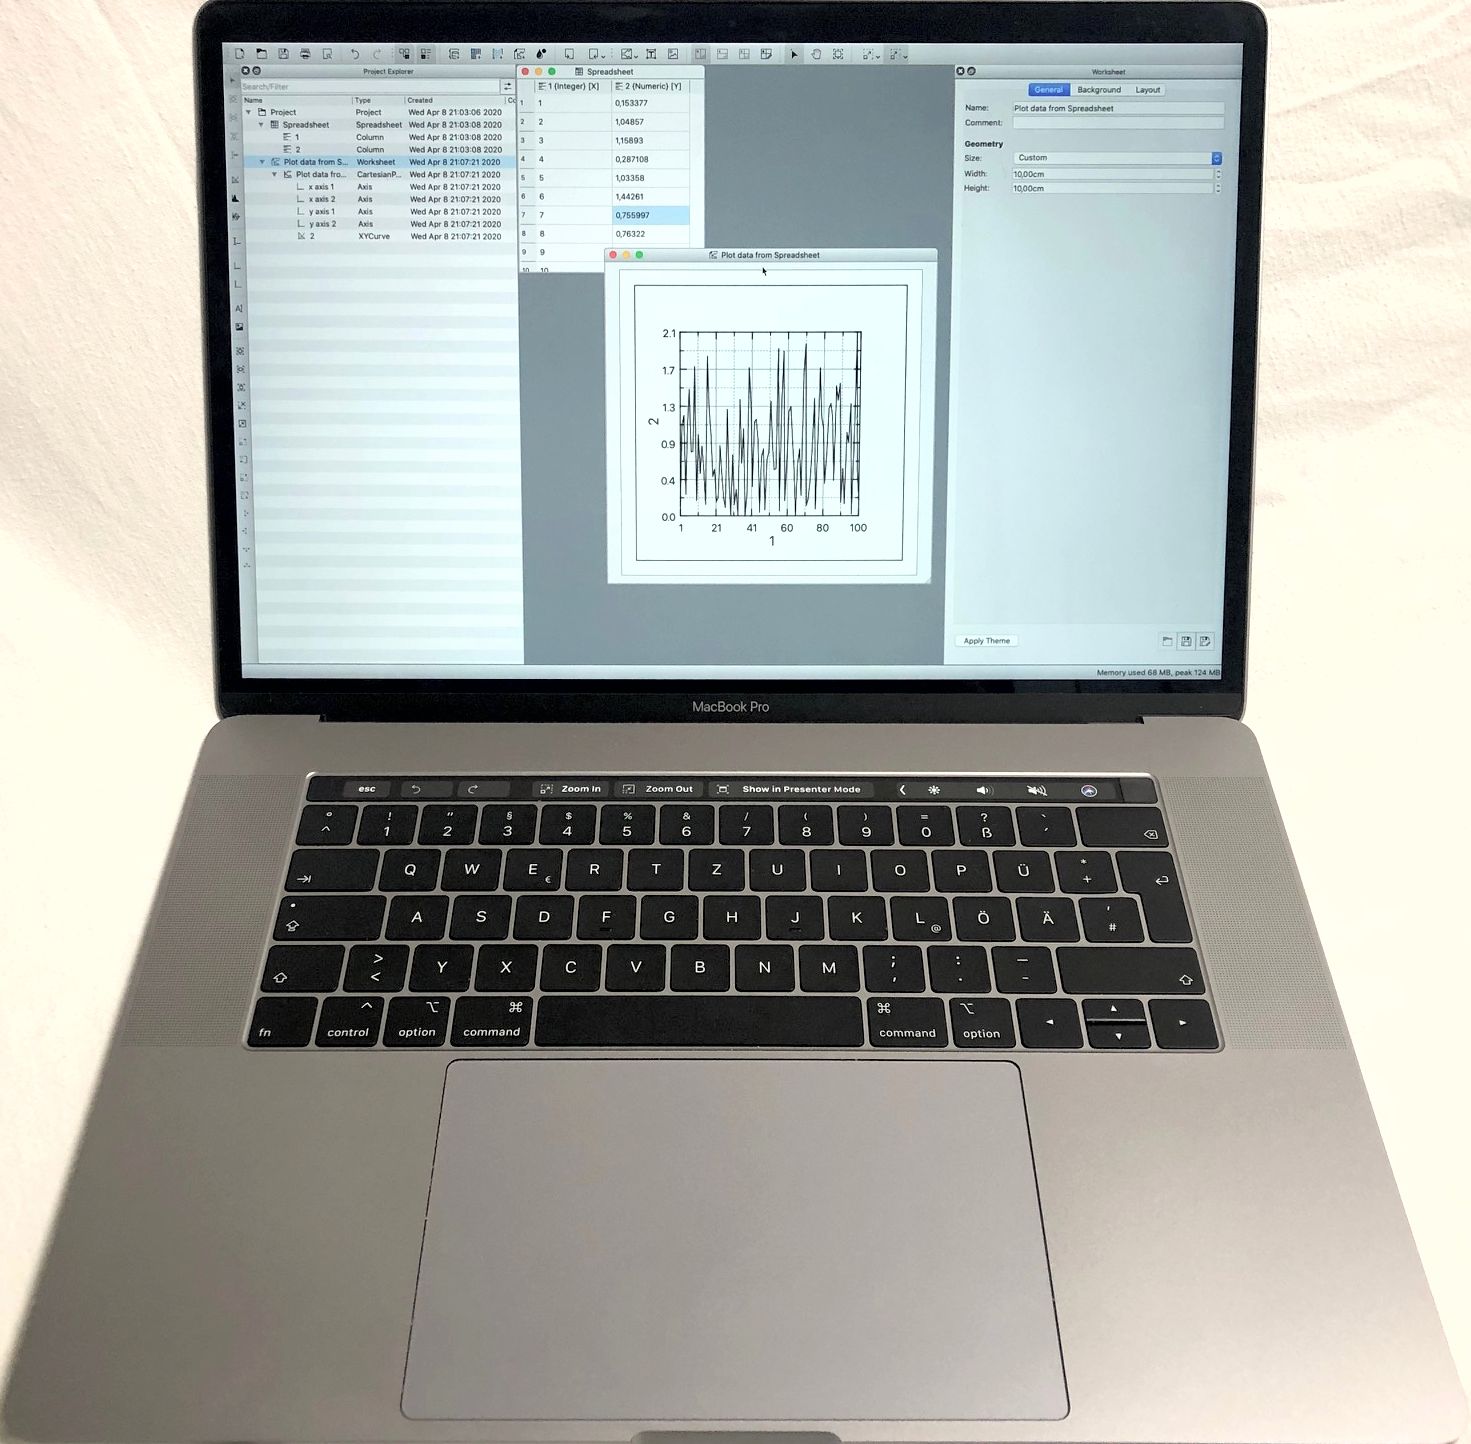
MacBook Pro models from 2016 (4th generation) and later come with a touch bar, an OLED touchscreen strip that replaces the function keys and provides also the place for the fingerprint sensor. This strip is placed above the usual keyboard and, unlike the function keys which have a fixed position and appearance, the content of the touch bar is adjusted automatically to the application that is currently being used, i.e. it has the focus. The applications have to support this, of course.
For the coming release of LabPlot we added some basic support for this and expose some of the most common and frequently used actions in the touch bar:

The screenshot above shows a simple session in LabPlot with a selected worksheet. For this worksheet, we show the undo and redo actions in the touch bar, as well as the zoom actions and the action to show the worksheet in the presenter mode:

Of course, all these actions are also available at different positions in the application – in the main menu, in the toolbar or in the context menu or are reachable via shortcuts – but having these common commands in a context sensitive manner right at your fingertips is very handy sometimes.
Thanks to the work done at KDAB and their library KDMacTouchBar, the implementation was rather trivial. This library provides a wrapper to Apple’s native interfaces in NSTouchBar and allowed us to use this hardware from Qt using QActions.
As mentioned above, in the coming release we’ll only provide some basic support for the touch bar and expose only a small number of actions there. In the future, we plan to expose more actions, for more objects and workflows in LabPlot and also to use more advanced stuff like nested levels of actions in the touch bar. Allowing the user to configure the content of the touch bar, similarly to how the content of the toolbars can already be configured, would be another nice feature to add down the road.

Any enhancements on the charting front, e.g. boxplots, stem-and-leaf plots, vertical/horizontal drop lines (to take just a few from SciDavis)? Anyway, thank you very much for your work!
P.S. I wonder if there is a way to download some data in a CSV format directly into LabPlot, for example from here:
https://stooq.com/q/d/l/?s=%5Espx&i=d
https://stooq.com/q/d/?s=%5Espx
Anything new on the plotting front? Do you plan to add new plots to Labplot?