Recent developments for the coming release
Despite a very active development in the recent couple of weeks, we still need to finalize a couple of things before we can do the release for version 2.8.
While going through the remaining issues, we found some time to work on users’ suggestions, test our nightly builds and provide feedback. We fixed several reported bugs and also implemented a couple of smaller features that were recently requested. The purpose of this short post is to update you on the latest developments.
LabPlot supports different analysis methods, like fitting, smoothing, Fourier transformation, etc. For smoothing we recently added the calculation of rough values. The difference between the approximating smooth function and the original data is called “rough” in this context (data = smooth + rough). This is very similar to the calculation of “residuals” for the fit algorithms. In 2.8 we calculate and expose the rough values, made it possible to visualize them and to check the goodness of the smoothing process. The example below demonstrates the first two plot iterations of a moving average smoothing algorithms applied to the original data and the second plot shows the corresponding rough values for both iterations:

In principle, such an iterative smoothing process can be automatically carried out until a certain “goodness of rough values” is achieved that was specified by the user. This is an interesting feature request that we recently added to our backlog.
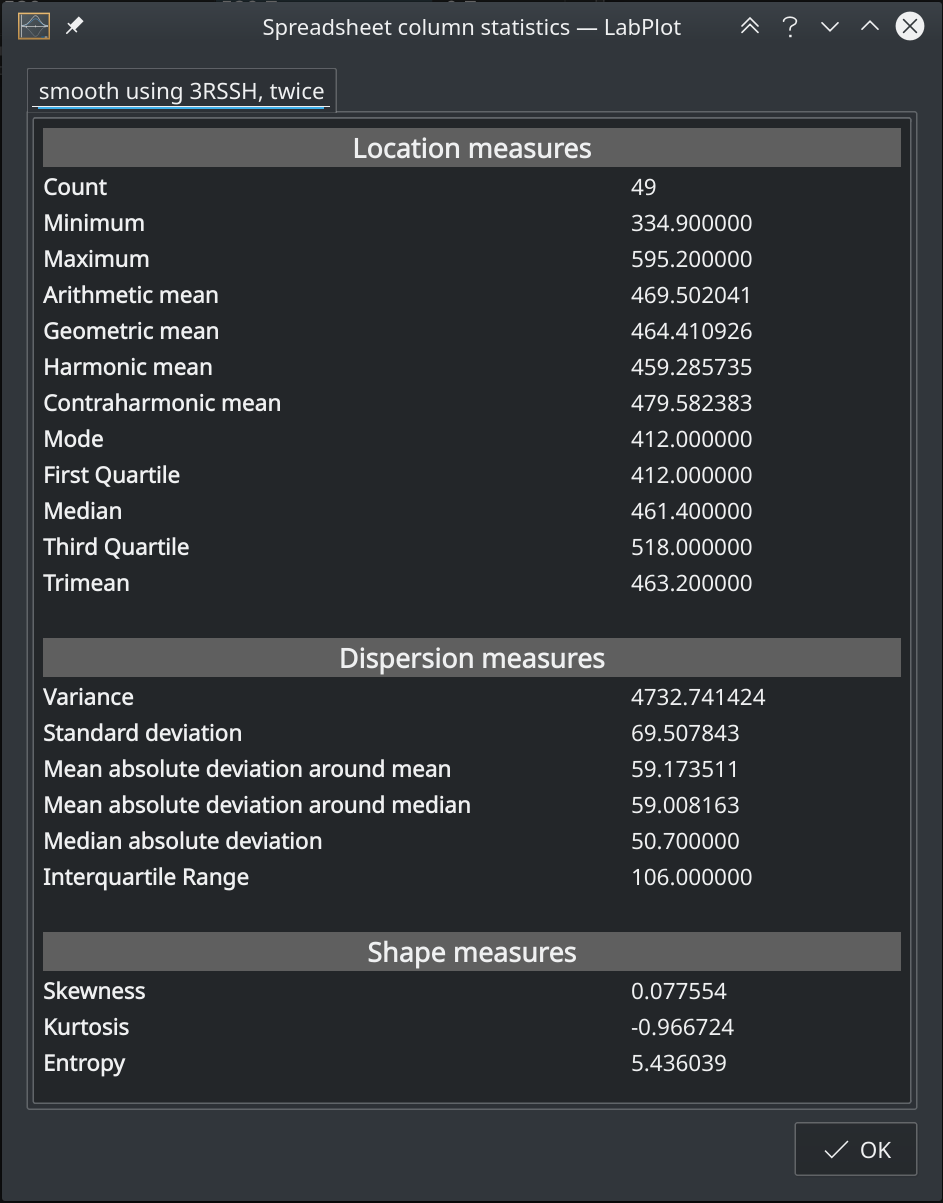
In the spreadsheet it is possible to get some descriptive statistics for the data sets. This information was extended a bit and we added the calculation of quartiles, trimean and of the statistical mode:
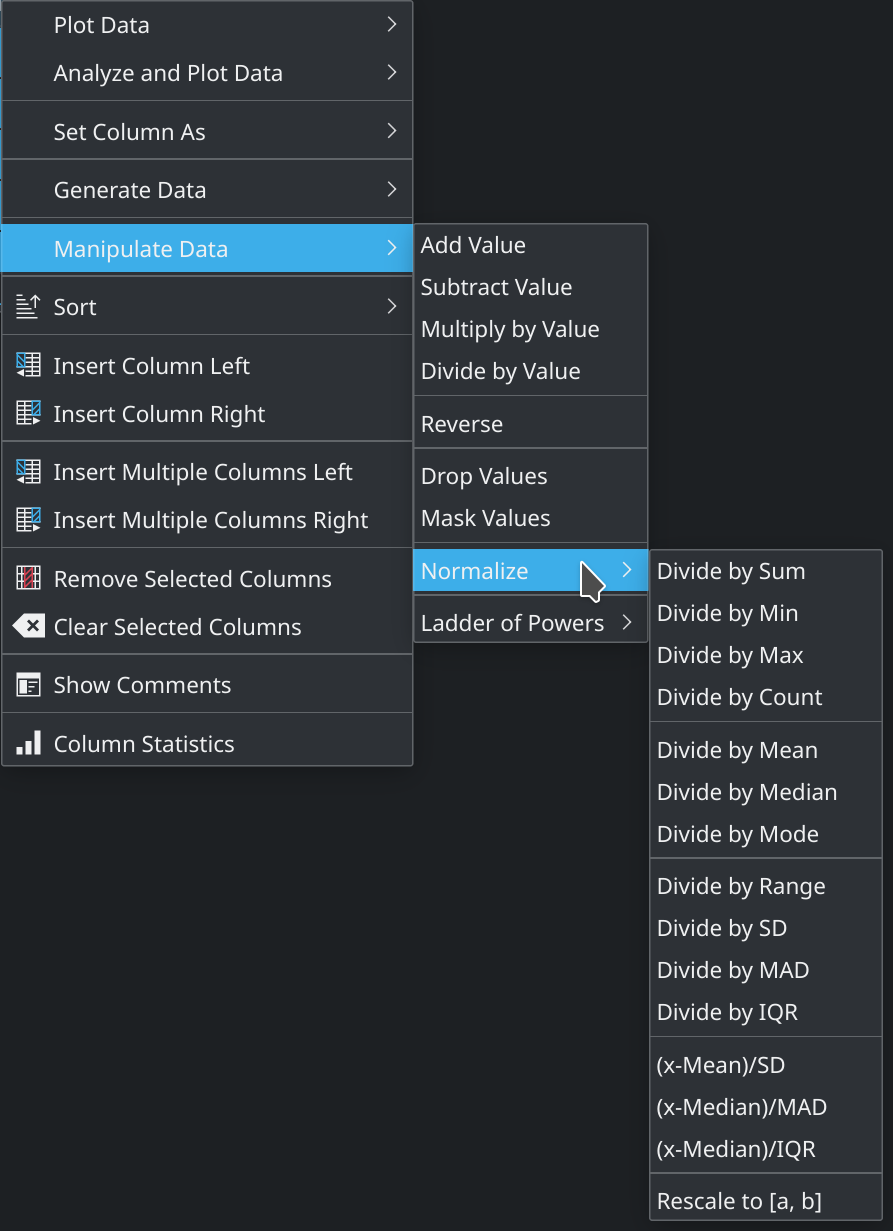
The list of normalization methods in the spreadsheet was also extended. We added a couple of new frequently used methods:
Furthermore, another small feature was added to the spreadsheet – the calculation of Tukey’s ladder of powers:
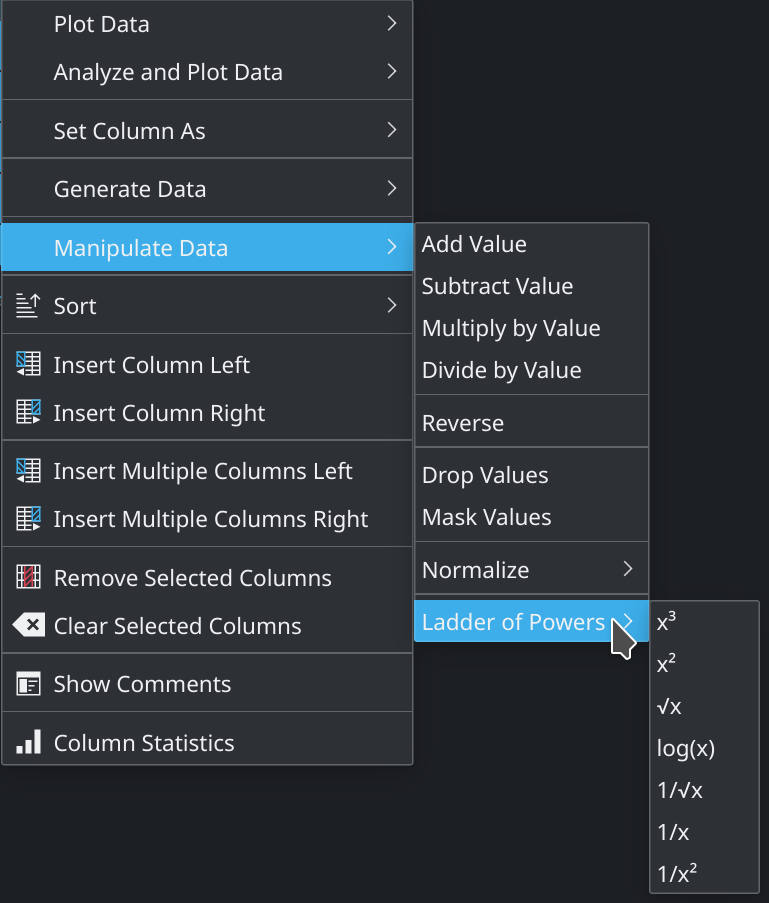
This page contains a couple of examples for this power transformation.
Of course, much more needs to be done to better support statistical analysis and workflows in LabPlot. In 2.9 we plan to add a significant amount of new relevant features for statistics. Check this blog post for an overview.
Having mentioned feature requests, no new or bigger features will be added in 2.8 anymore. The plan is to now fix the remaining issues for 2.8 and to invite people soon to beta test it, get more feedback from a broader audience and release it shortly after this.