Reference lines and image elements
We continue working on the plotting capabilities of LabPlot. In the next release we will be adding two new worksheet objects to provide more flexibility and features to create attractive looking visualizations. In this short blog post we want to report on this recent development.
Reference Line
Reference lines are placed on the plot to attract the attention to certain values and patterns in the visualized data. The reference lines can have both orientations, horizontal and vertical, to highlight x- and y-values. The lines can be positioned either by dragging with the mouse or, for a more precise positioning, by entering the exact position value in the properties widget of the reference line.
Image Element
The image element allows to add an image to the plot or to the worksheet. Several properties of the image like the size, position, the style of the border line and the opacity of the image can be adjusted to get the desired result.
Demo
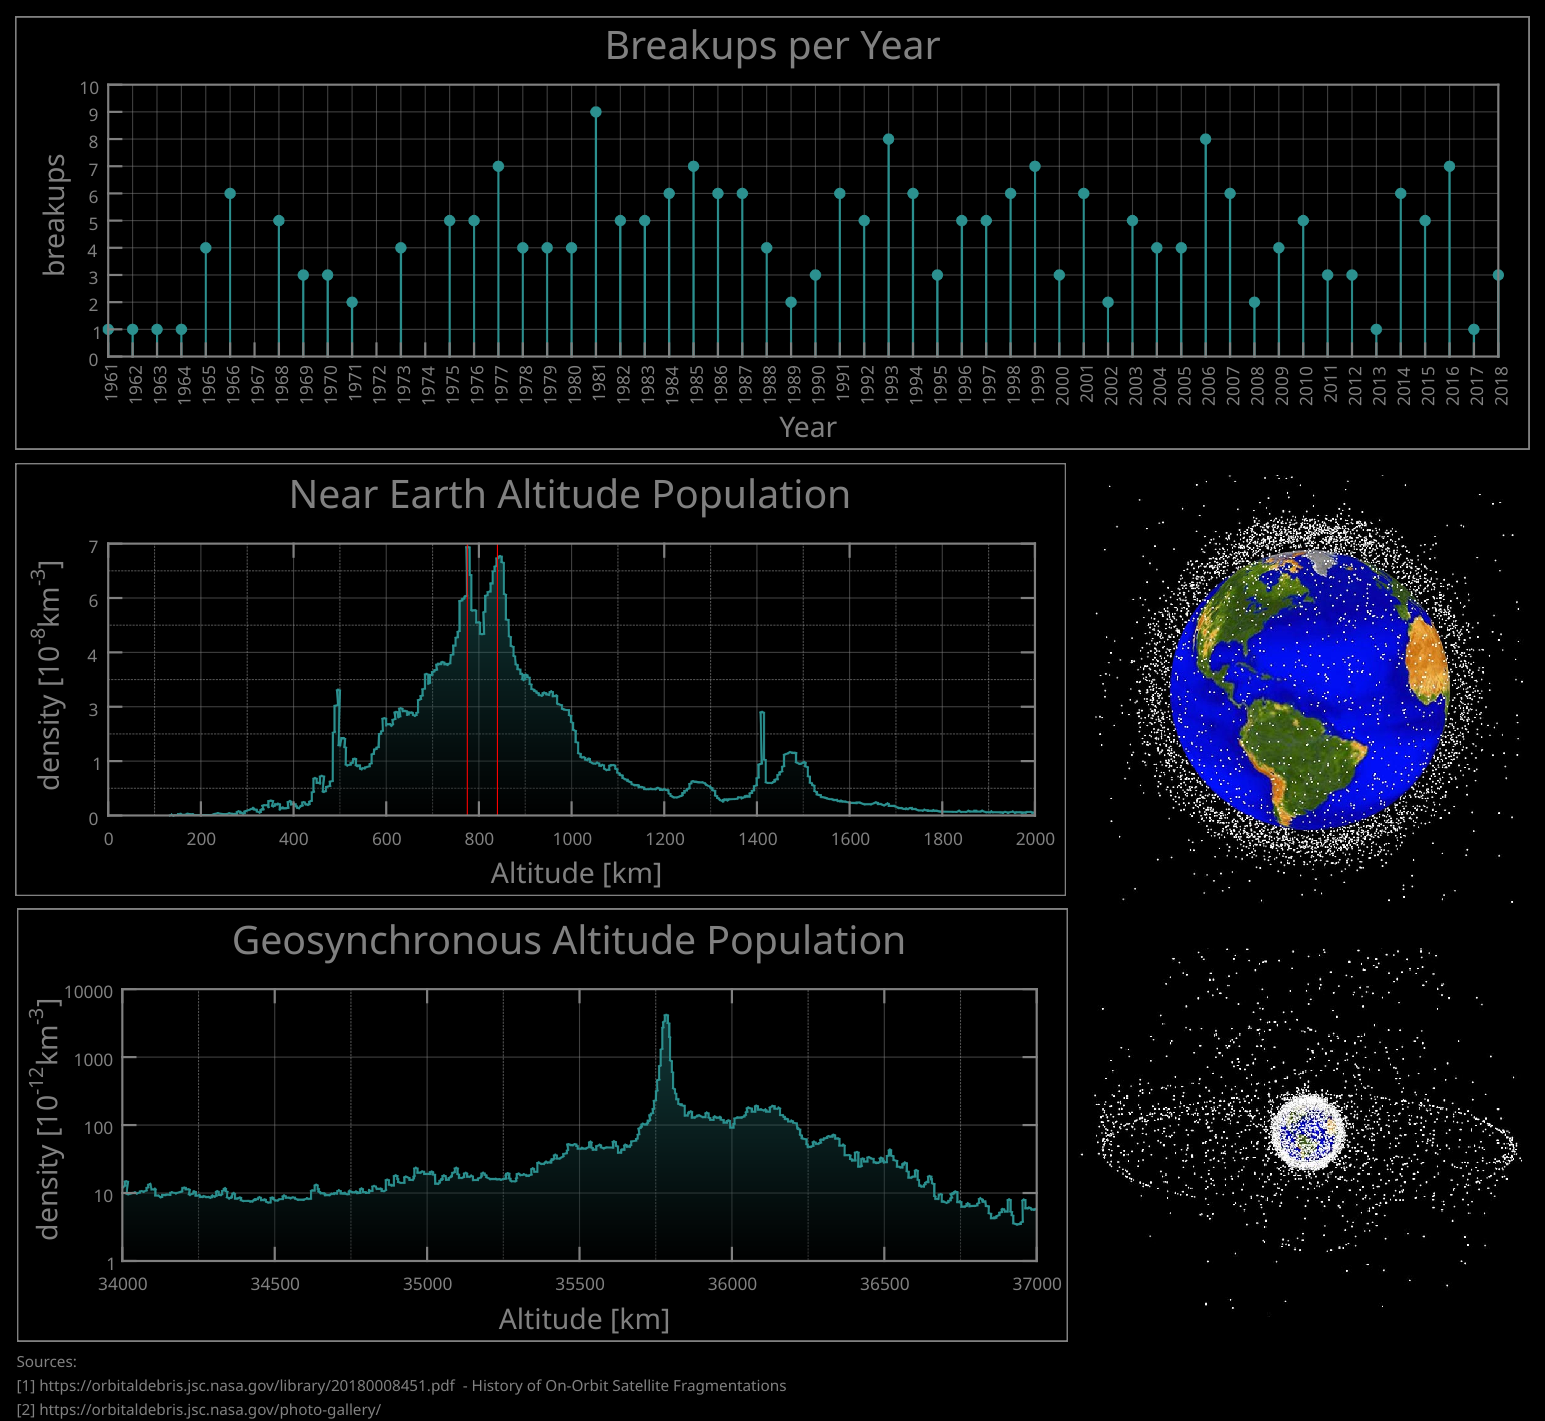
The worksheet below demonstrates the usage of these two new objects. It shows some statistics about the amount of debris created and left floating in space since 1961:

The largest contributor to space debris is the breakup of satellites. The first plot shows the number of breakups starting with first occurring in 1961 and then all of the rest until 2018.
The next two plots show the density distribution of objects for near Earth altitudes as well as for the altitudes around the geosynchronous orbit.
The two red reference lines on the plot for the spatial density of objects for near Earth altitudes are used to highlight two peaks in the density distributions. These two peaks correspond to the accidental collision of Iridium 33 and Kosmos 2251 spacecrafts in 2009 and to the anti-satellite missile test conducted by China in 2007. These two events caused a substantial amount of debris at the corresponding altitudes.
The image elements besides the plots show the graphical distributions of the biggest trackable objects around the Earth.
The data is taken from History of On-Orbit Satellite Fragmentations provided by the NASA Orbital Debris Program Office (ODPO), the images are taken from ODPO’s gallery.
Wondering how the data for the spacial density was extracted from the PDF document provided by ODPO? Check out the the release announcement of 2.7 and the video demoing the recent improvements in LabPlot’s data picker – our tool to digitize the data values on images: