LabPlot 2.7 released
We are happy to announce the release of LabPlot 2.7. The biggest effort in this version went into improving the user experience to make working with LabPlot easier and fun.
Spreadsheet
The Spreadsheet is where plots get data from. It consists usually of columns containing the imported data or the data entered manually by the user. Besides this, the content of a calculated column in the spreadsheet is computed using a mathematical expression applied to the content of other columns in the same spreadsheet.
Such calculated columns are now more flexible and react to data changes in the parameter columns when they get deleted or re-added. When such changes occur the content of the calculated column is properly updated or invalidated.
The Functions Values dialog is where calculated columns are defined. A red-highlight in this dialog indicates that one of the parameter columns in a calculation was deleted from the project. This dialog also prevents selecting the calculated column as a parameter column and thus avoids circular dependencies.
The Used in entry in the context menu of a column shows all the curves where the contents of a column is used. This allows you to quickly navigate from the spreadsheet to the curve in a plot where the data is shown. This menu entry was extended in 2.7 and now also shows the calculated columns where the column is used as a parameter.
In prior versions of LabPlot, if you deleted a column, the connection between the deleted column and the plot curve was lost, regardless of whether the column was re-added later again with the same name. We have corrected this behavior in 2.7 and now LabPlot monitors all columns for changes and automatically updates the plots if a previously deleted data column is re-created. This is especially handy if you frequently need to re-import different data files containing columns with the same names: LabPlot automatically updates the plots after every change.
We have fixed many smaller glitches in copy & paste. For example, in this version, when pasting data into empty columns, the column data type is automatically converted to the type of the data being pasted.
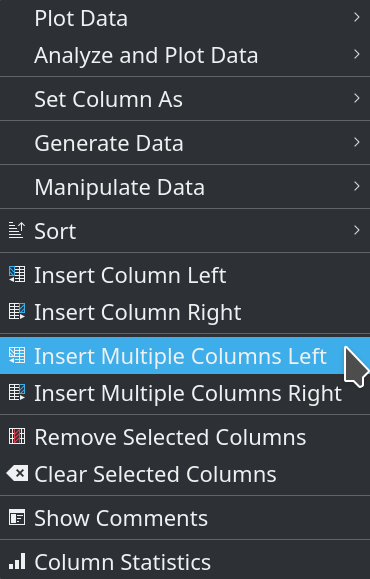
Finally you can now add/insert multiple rows and columns in one single step using the context menu.
Reading Data
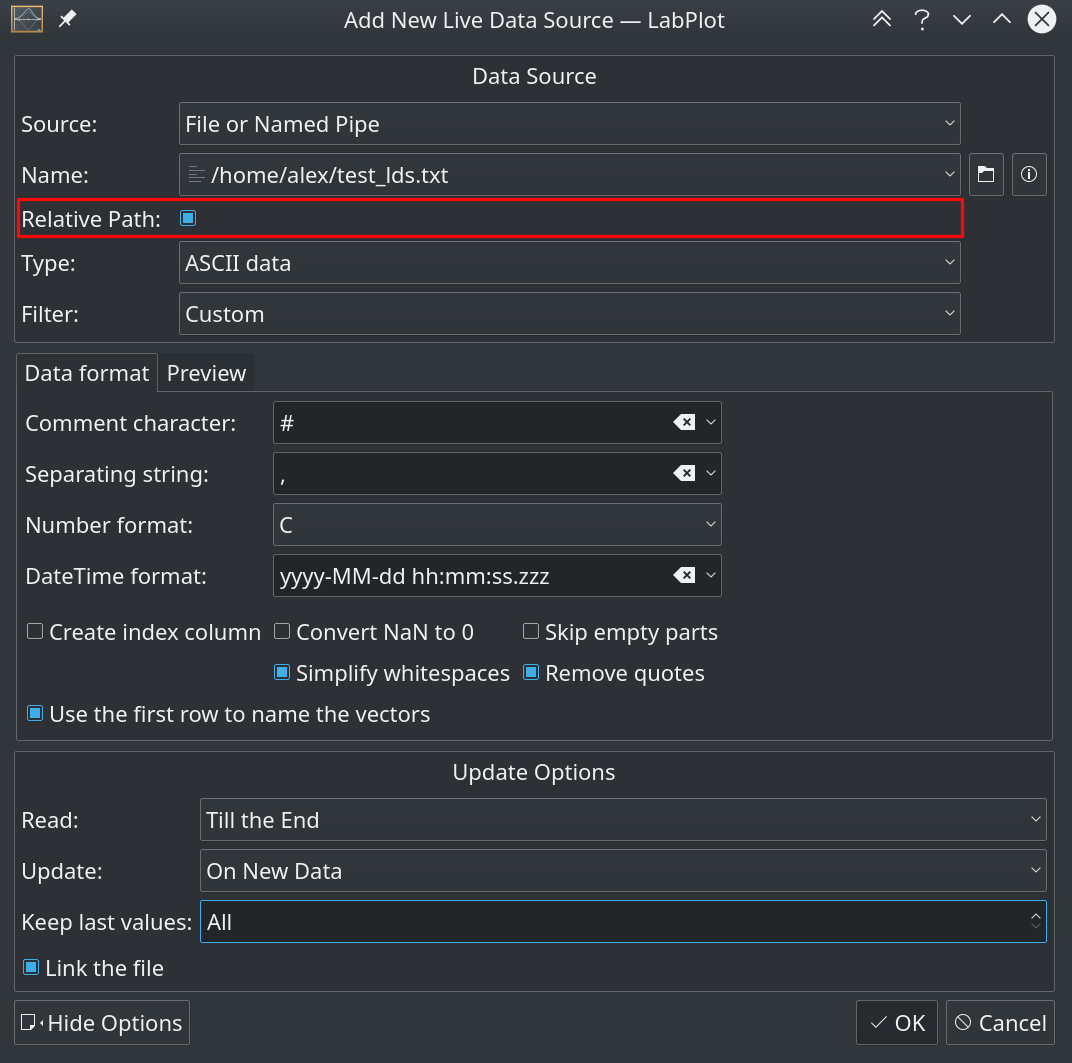
When reading live data from file sources you can now use a relative path to find a live data source. This allows you to, for example, copy the folder containing the project file together with the data file or files across different folders on your computer without loosing the connection to the file or files.
Another novelty is that the ROOT import filter has been extended to support directory structures in ROOT files.
Project Explorer
In the Project Explorer you can now move top-level objects to different folders via drag & drop.
Unfortunately, copy & paste of objects in the Project Explorer is still missing. This missing functionality is at the very top of our ToDo-list.
Plotting Tools
LabPlot allows for interactive working with the plots. You can navigate through the data with the mouse, zoom in by spinning the mouse wheel, and so on. However, sometimes you want to “freeze” the plot during your work to avoid involuntary mouse events from changing the plot accidentally. To achieve this we have implemented the non-interactive mode in the worksheet. You can find this mode by right-clicking on the worksheet and opening the context menu. The non-interactive mode is one of the options in the context menu.
This new feature comes in handy for demos and presentations where you don’t want anything to change or if you are plotting big amounts of data and an unwanted mouse event could cause a heavy repainting. Note that the navigation, scaling and zooming features are still available in non-interactive mode from the toolbar. Only mouse events are ignored.
The data picker allows you to digitize data points on images. The data picker was first released in 2.2, and has received an overhaul in 2.7. We have greatly simplified the overall workflow and the process of digitizing data points. The following video shows how easy it is now to read data from a plot:
A new and major feature we have implemented in this release is the plot cursor. The plot cursor is a tool you use on the worksheet to measure the current position under the mouse cursor. You can use it to read the X-value and the Y-values for all the curves in the plot and also the distance between two points. Select this tool in the plot toolbar, set the first cursor by clicking in the plot and then set the second cursor by holding down CTRL and right-clicking within the plot in a different position. The cursors can be freely moved once set in the plot.
By default, the cursors in different plots are linked together. This behavior can be changed, making independent measurements in the different plots possible.
Performance Enhancements
Another major development has been the re-design of the algorithms dealing with the data handling and painting of plots. This has speed up the drawing of plot data points. The new algorithm optimizes drawing by skipping data points that would fall on the same pixel on the screen. Also, for subsequent points that fall on the same pixel on the x-axis, the algorithm draws a single line between the highest y value and the lowest y value instead of drawing multiple lines.
Though the calculation of what can be skipped and merged takes some time, this calculation is much faster than having to paint points and lines that would be skipped or merged. Reducing the overall amount of data to be plotted results in a substantial improvement of performance in many scenarios with dense data. An example is the screenshot below, showing a “signal” with 1 million data points:
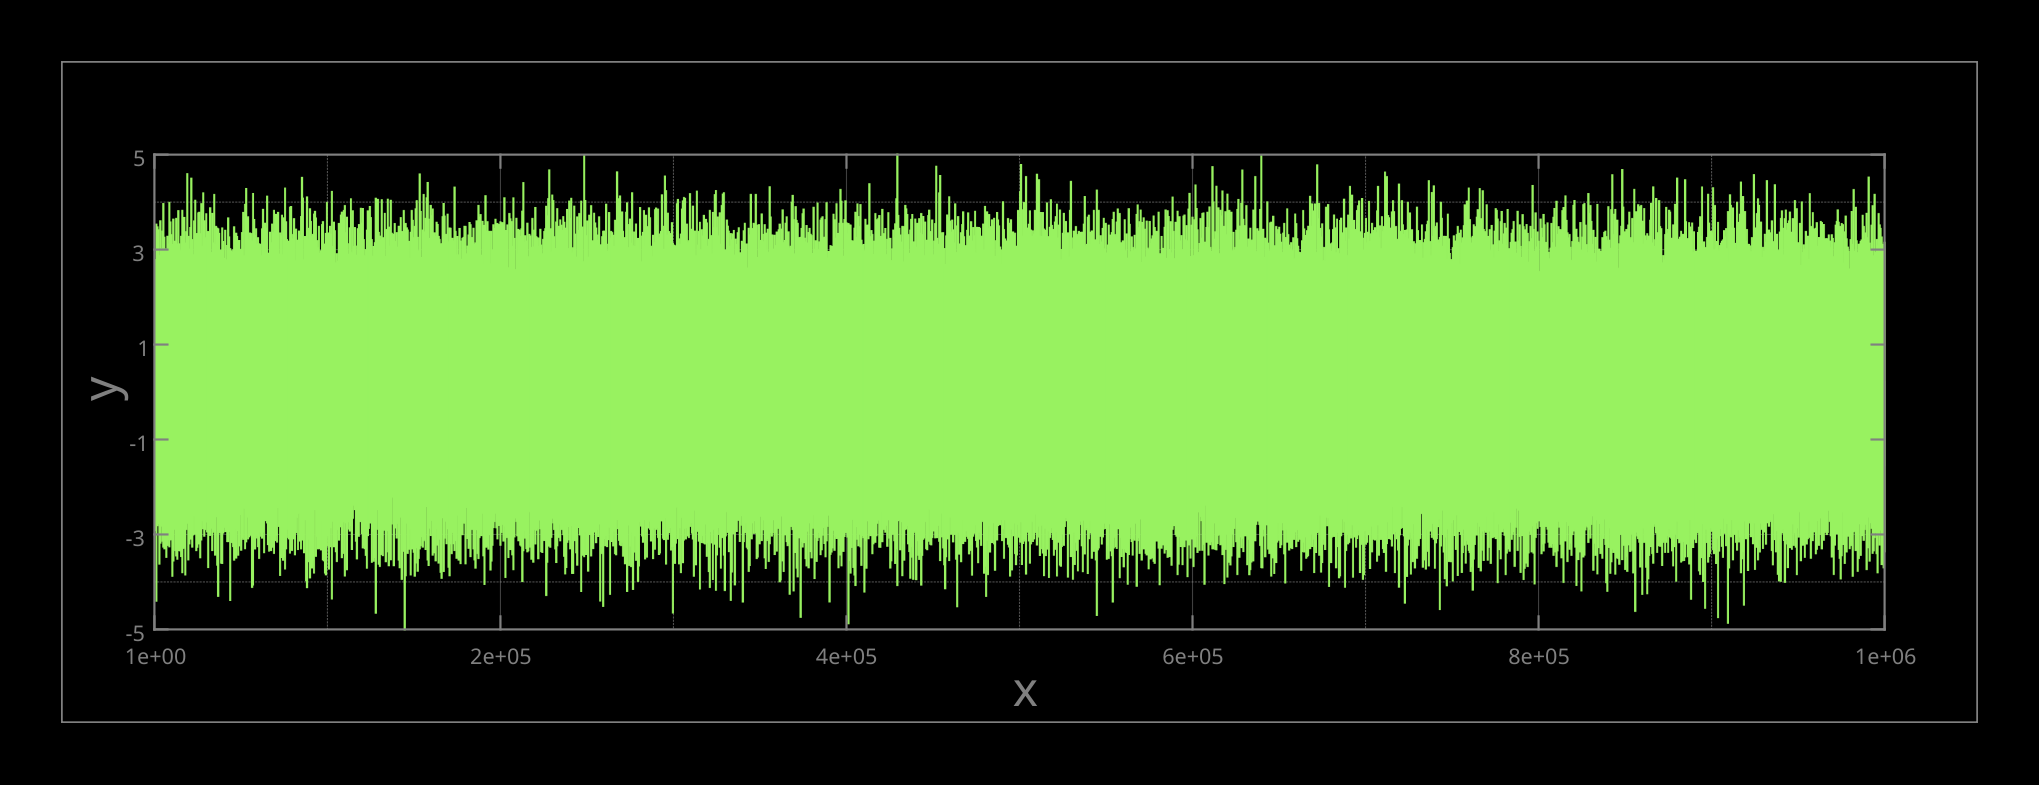
For example, the processing and drawing of this data took ca. 3 seconds in LabPlot 2.6 on CPU Intel Core i5 4460 4x 3.20GHz. In LabPlot 2.7 it only took ca 90ms.
We hope you enjoy all these improvements as much as we enjoyed making them. We look forward to your feedback on LabPlot 2.7!
The work on the next release has already started. There are many new features planned for LabPlot 2.8. We have also had some very nice results from our Google Summer of Code students this year and we’ll start including them into the next release soon.
Stay tuned!