(sloccount-/git-) History of LabPlot
After the recent release was finalized, there is some time now to have a (very) short break in the development, to take care of some organizational topics around the project and to set the development priorities for the next release. But there is also some time now to look back at where we started several years ago and where we are now. In this blog post we want to look at the history of the code base.
LabPlot is quite an old project started long time ago, back in KDE3 times. One of the important milestones of this project was the complete rewrite using Qt4/KDELibs4 in 2008. This is when new developers joined the project, at least for a certain period in time, and when the jump from 1.x to 2.x release versioning was done for LabPlot. Starting from zero and lacking a lot of features in the 2.0 release, we gradually evolved release by release by implementing new features and by improving the code base.
SLOCCount is a handy tool to determine the number of source lines of code (SLOC) for every language used in the project. Besides counting the lines of code, this tool provides some other metrics to estimate the development costs. For this, SLOCCount can use internally different models to estimate the project costs. On default, the Constructive Cost Model (COCOMO) is used.
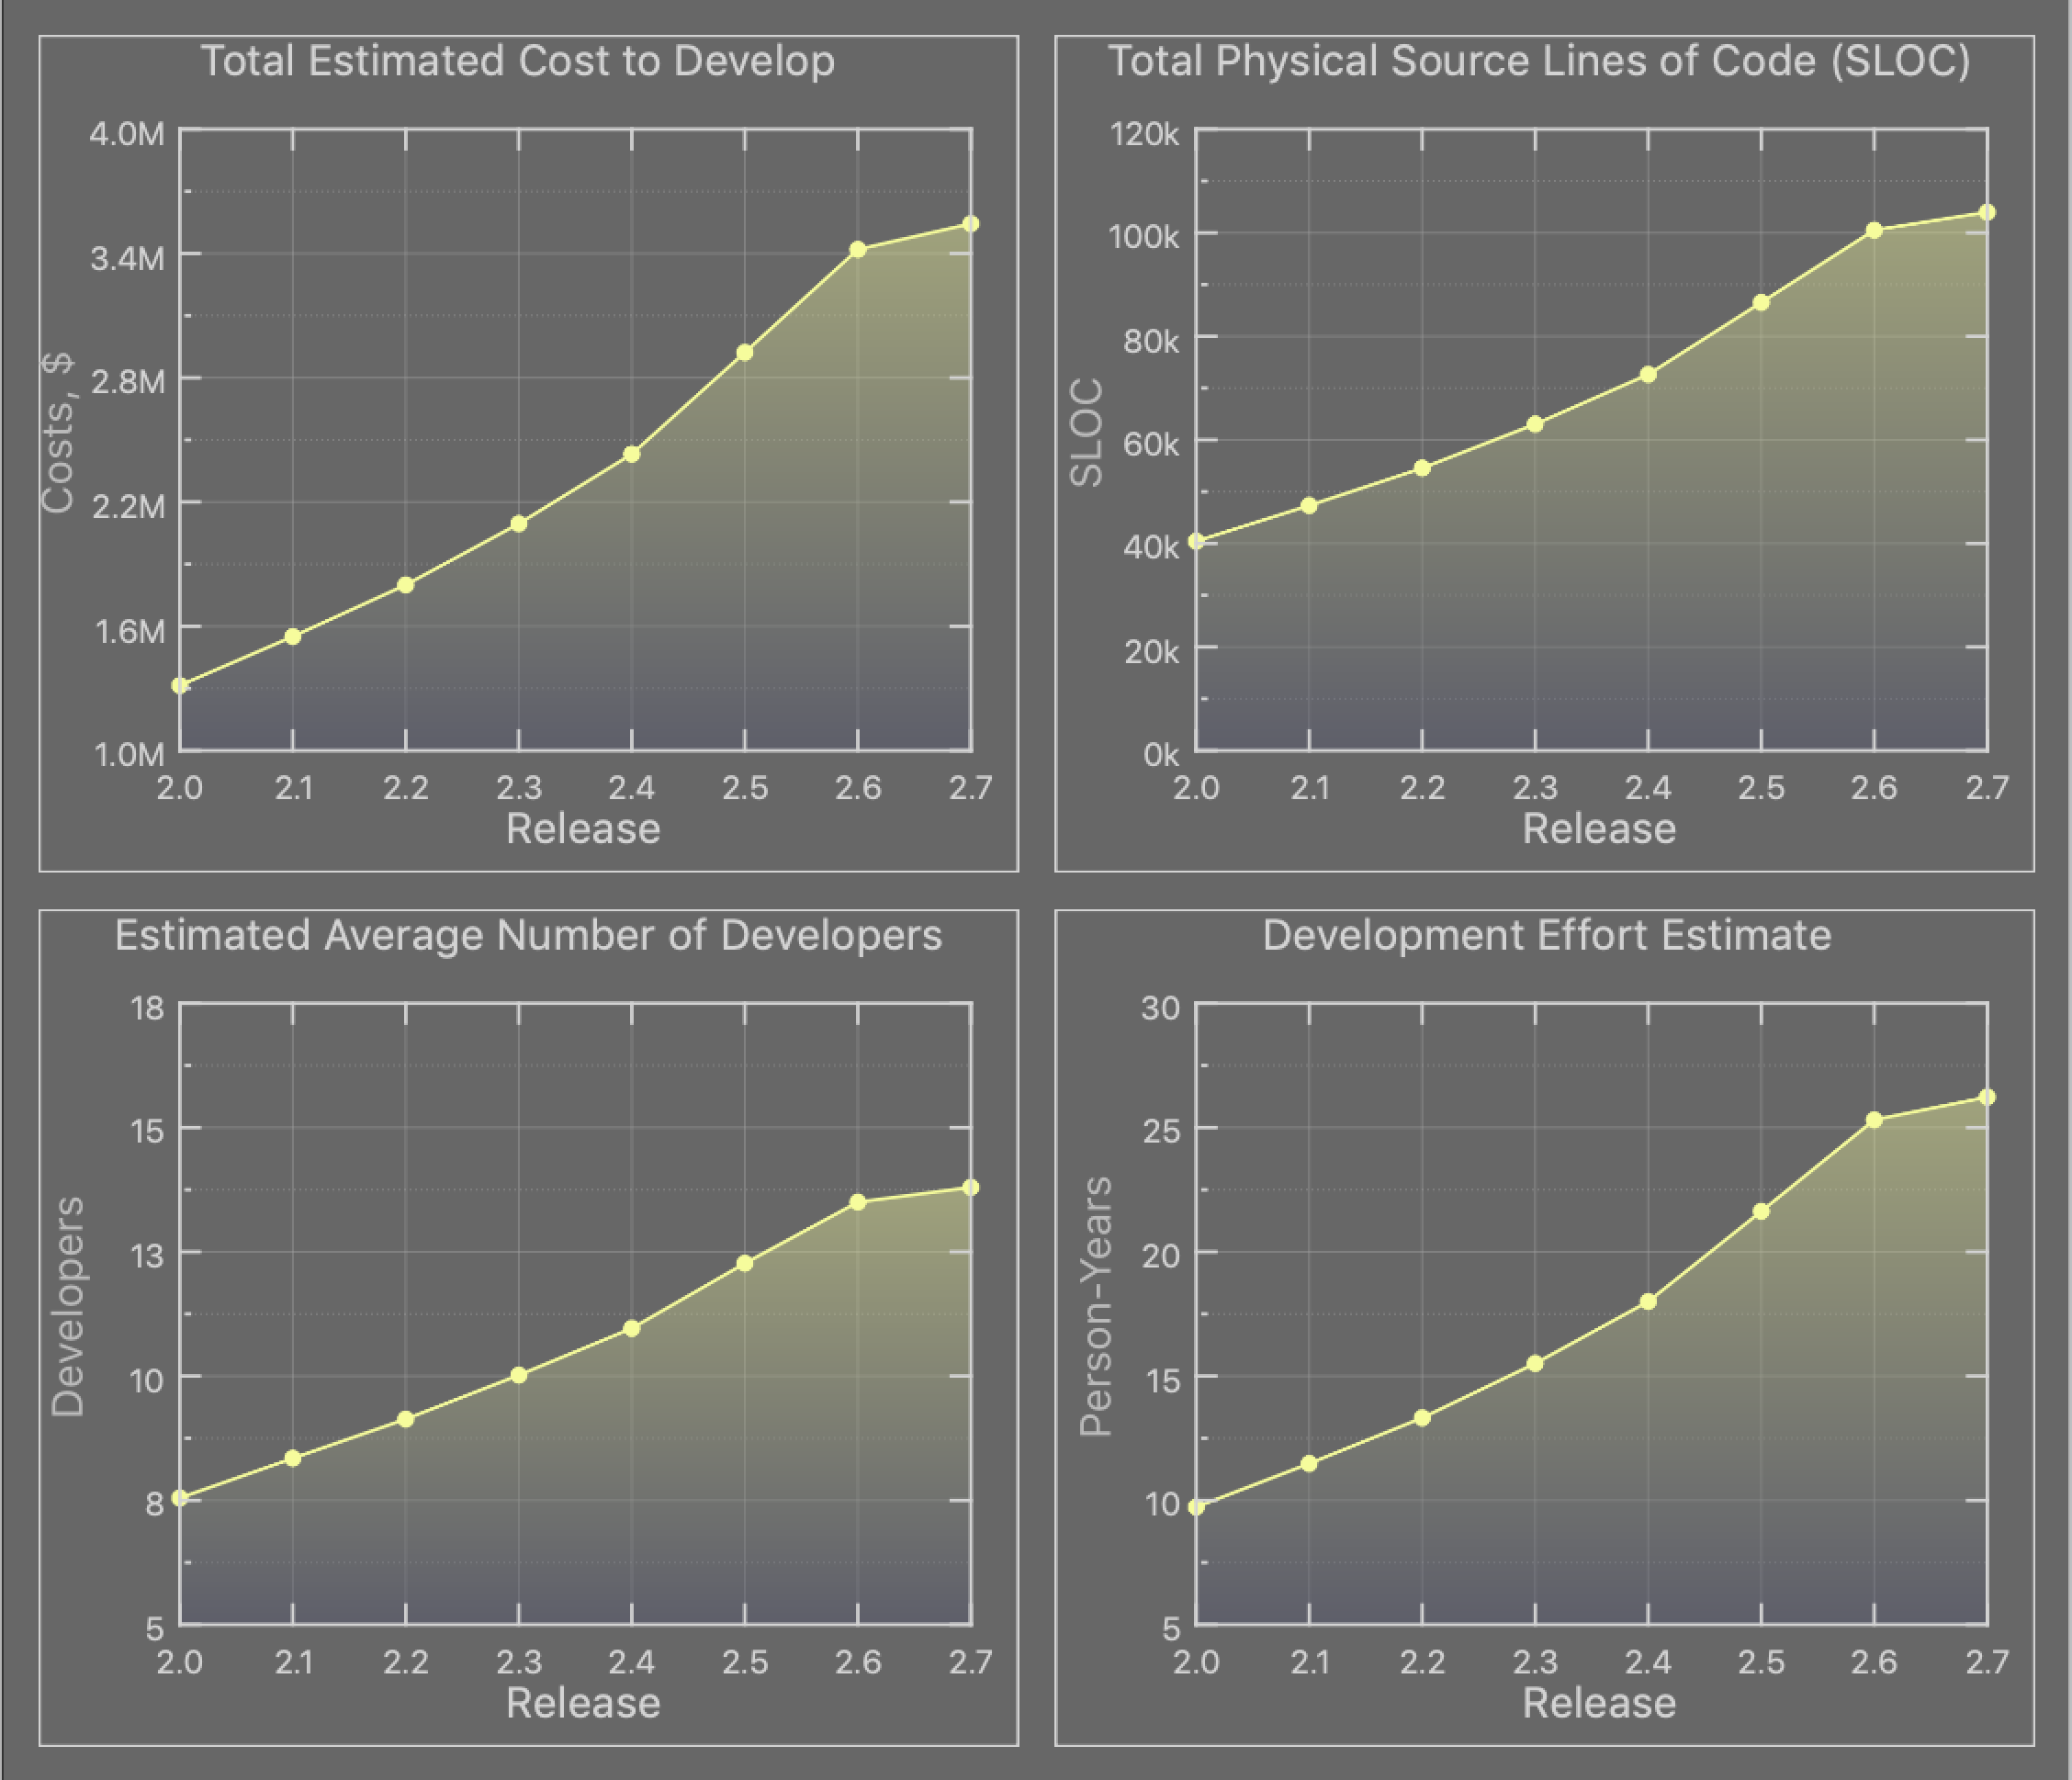
Running SLOCCount on LabPlot’s code for all 2.x releases leads to the following numbers:

We have ca. 100k lines of code in total with the major parts written in C++ (ca. 95%) and in C (ca. 4%) and with much smaller contributions of shell and python scripts used in some tests and of the syntax definitions for GNU Bison. The latter is used internally for the parser of mathematical expressions.
The role of C++ in a Qt/KF based application is clear. C is used for mathematical algorithms in our project. This C-code, internally called Numeric Scientific Library (NSL), goes beyond what is offered by GNU Scientific Library (GSL), that is used by LabPlot already for many different things like FFT, interpolation, etc. In future, if time and resources permit we can think of bringing NSL into GSL or releasing it as library independently of LabPlot.
For LabPlot, having only two core developers over the last years plus some irregular contributions from other developers and GSoC-students, this model heavily over-estimates the number of developers involved in this project. Similarly, the development effort is over-estimated which probably has the same reasons.
So, we show all these numbers without going too much into the details of COCOMO and without elaborating on trust we put into the numbers calculated based on the heuristics and assumptions behind this model. And we don’t conclude from these numbers that we over-perform the “average developer” used by COCOMO and SLOCCount to estimate the effort and costs 🙂
It is also interesting to see how the code base grew release by release and how long it took for us to do the actual release. This information can be easily collected with git and by checking the release dates:
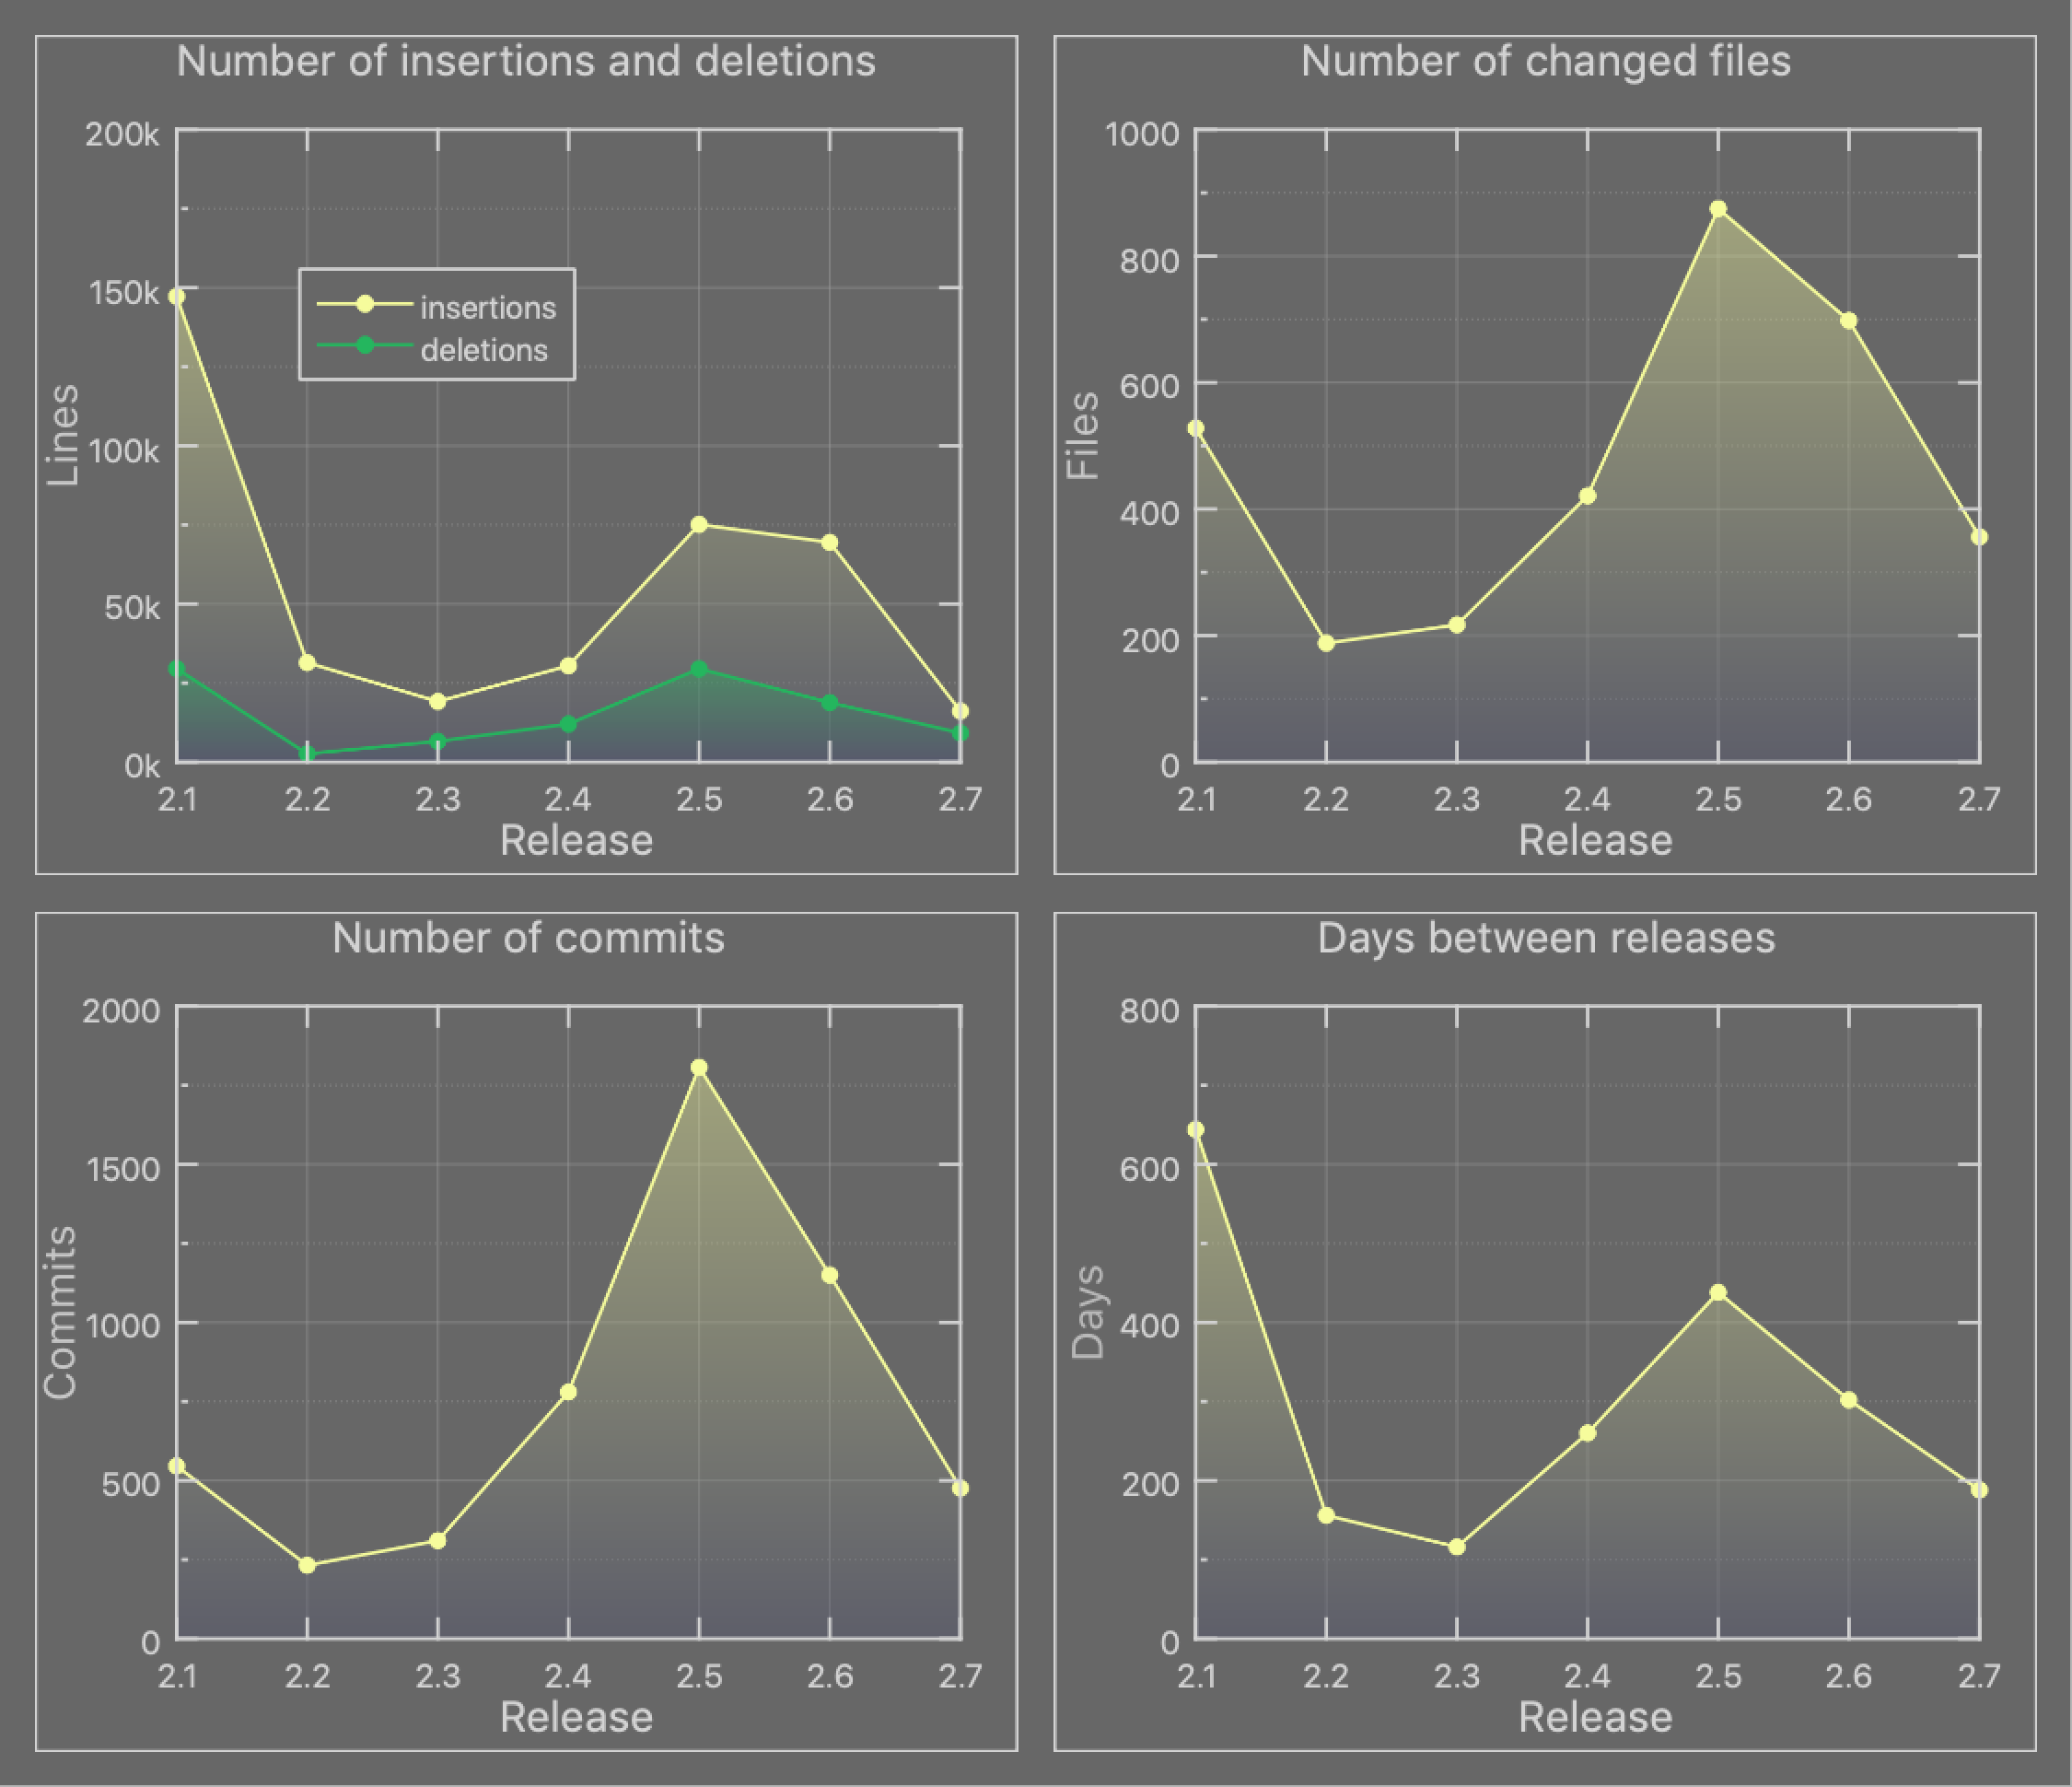
To get meaningful results for “Days between releases” in this visualization we don’t show the first 2.x-release, being 2.0, and start with 2.1.
The number of insertions and deletions shown here counts also changes done on the documentation files, tests files, etc. and doesn’t sum up to the total number of SLOCs shown above where only the actual source code is considered.
The relatively small number of new code added in 2.7 is because of the overall focus on stabilization and polishing done in this release as also stated in the release announcement for 2.7.
We’d like to release more frequently. This is not always easy given the limited amount of resources on our side. But the overall trend for the last two releases goes into the proper direction and we want we can keep this trend and momentum for the next releases.