Color Maps and Conditional Formatting
When visualizing the data, mapping of values to colors is one of essential steps. There is an extensive discussion in the literature about the proper selection of colors (see e.g. the publications mentioned here), and there are multiple publicly available collections of color maps that are designed to deliver best results in scientific visualization applications. For the coming release 2.9 we added some of the well-known collections to LabPlot. Currently available collections of color maps are:
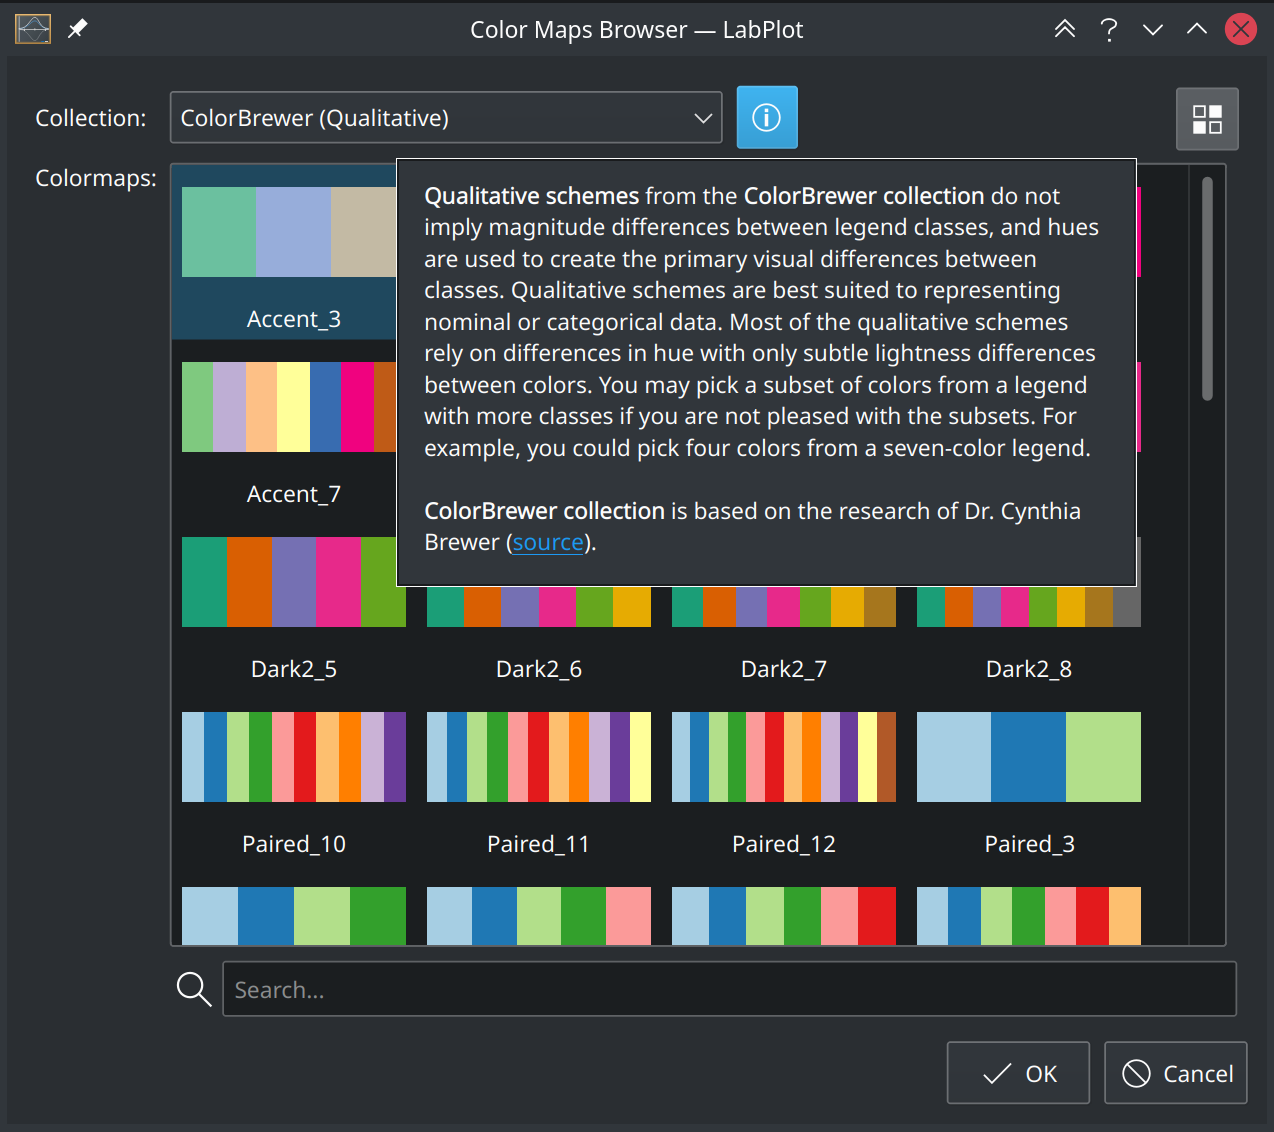
The access to the color maps defined in these collections is done via the new Color Maps Browser:

The switch between the different collections and their sub-categories is done directly in this browser:

Additional short information is provided for every available collection together with the link to the original source:

As the first application and usage of the color maps is LabPlot we implemented the conditional formatting in the spreadsheet. This feature, well-known from other spreadsheet applications like LibreCalc, etc., allows to highlight the cells in the spreadsheet according to some rules (or conditions). There’re multiple ways to defined such conditions, on of them is based on a “heatmap”. Heatmap based conditional formatting colors the cells according to a color map and the number. The number of “value levels” determining the way how the values are grouped or clustered corresponds to the number of colors defined in such a color map.
There is a new dialog in the spreadsheet now allowing the user to define the heatmap formatting according to the levels in a color map:

The formatting is either applied to all columns in the spreadsheet or to selected only. It is also possible to specify how and where the color hightlighting should be applied. The different options available here (“Background”, “Font Color” or “Icon”) lead to the results as on the screenshots below:

More usage of the color maps will be added in future, especially when we start adding heatmap visualizations or visualizations of 3D surfaces.