Import of JSON and ngspice files
We continue adding support for more data formats that can be imported into LabPlot. As part of the upcoming release we add the support for JSON file and for ngspice raw file format which we want to introduce in this short blog post. After the…
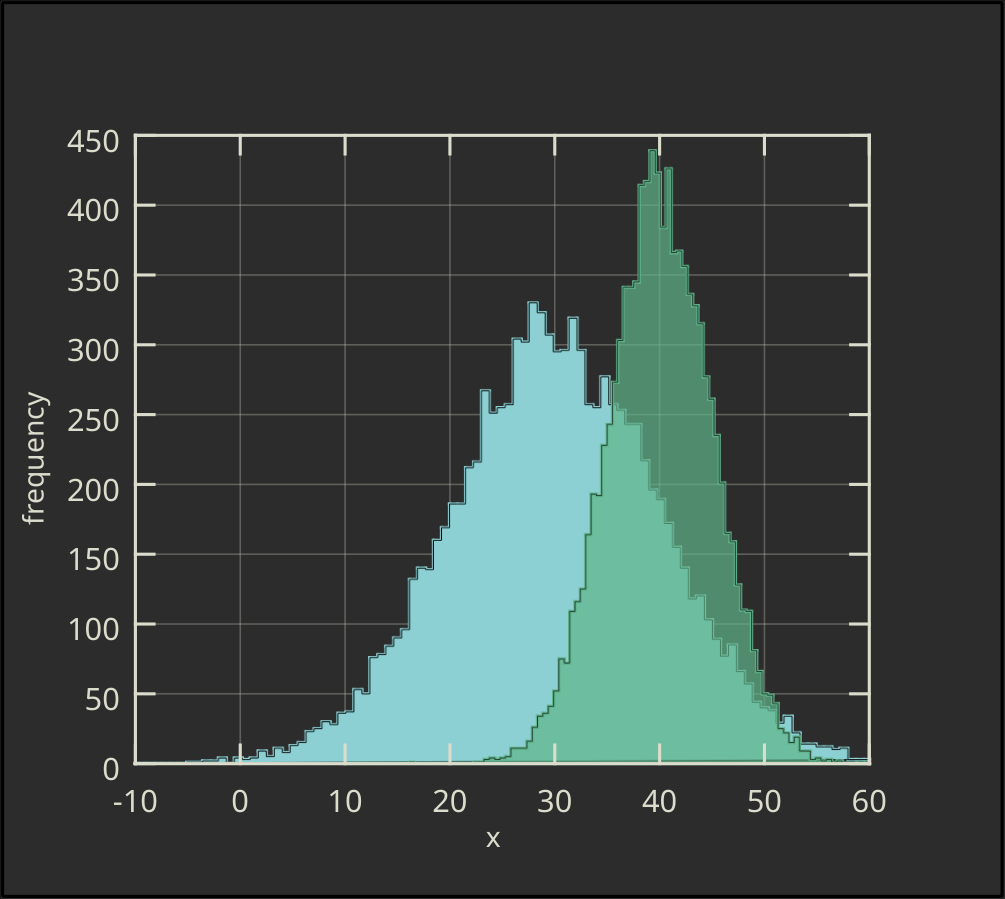
Histogram
LabPlot has already quite a good feature set that allows to create 2D Cartesian plots with a lot of editing possibilities and with a good variety of different data sources supported. Analysis functionality is also getting more and more extended and matured with every release….
LabPlot 2.5 released
It took much more time to finalize the release than we planned in the beginning after the 2.4 release was done. But we hope the number of features we implemented for 2.5 and their impact on the workflows supported by LabPlot can justify this delay….
Support for live data
Coming close to the next release of LabPlot, the last new feature in this release that we want to introduce is the support for live data. This feature developed by Fábián Kristóf during “Google Summer of Code 2017” program. In this context, the support for…
Import of Origin and LabPlot projects
We had to revise our release plans because of a feature that many users have asked for and that took more time than estimated – the import of © OriginLab Origin projects. Since this feature is quite important and since we had some implementation for…
Improved data fitting in 2.5
Continuing the introduction of the new features coming soon with the next release of LabPlot (see the previous blogs here and here), we want to share today some news about the developments we did for the data fitting (linear and non-linear regression analysis) in the…
Short update on recent UX improvements
One of the usual data visualization workflows supported by LabPlot involves the import of some external data into the application and the creation of plots. Once the data is imported, e.g. into a spreadsheet, there are basically the following steps to do in order to…
Import from SQL databases
As already mentioned in the previous post, we plan to finalize the next release of LabPlot by the end of this year. A lot of new features for 2.5 are implemented and can be already tried out. In this short post we want to introduce…
No Qt4/KDE4libs version of LabPlot anymore
In the past there were two versions of LabPlot. The first one was based on Qt4 and KDE4 libraries. The second one uses Qt 5 and KDE frameworks 5. The development was done mainly in the Qt4-based branch which was merged from time to time…
LabPlot 2.4 released
We are happy to announce the next release of LabPlot! The concise list of changes is available in the changelog. In the following we describe the most important new features in more details. Beginning with the previous release, LabPlot is available for the Windows platform….