Import from SQL databases
As already mentioned in the previous post, we plan to finalize the next release of LabPlot by the end of this year. A lot of new features for 2.5 are implemented and can be already tried out. In this short post we want to introduce one of the new features – the import from SQL databases. At the moment, LabPlot supports reading from files in different formats (ASCII, binary, HDF5, NetCDF and FITS) only. With this new feature it is now also possible to read structured date from SQL databases. The supported databases are those that are covered by Qt SQL.
Similar to the already existing “Import dialog” for files, there is now a new dialog for importing from the databases that guides the user through the process of selection and import of the relevant data.
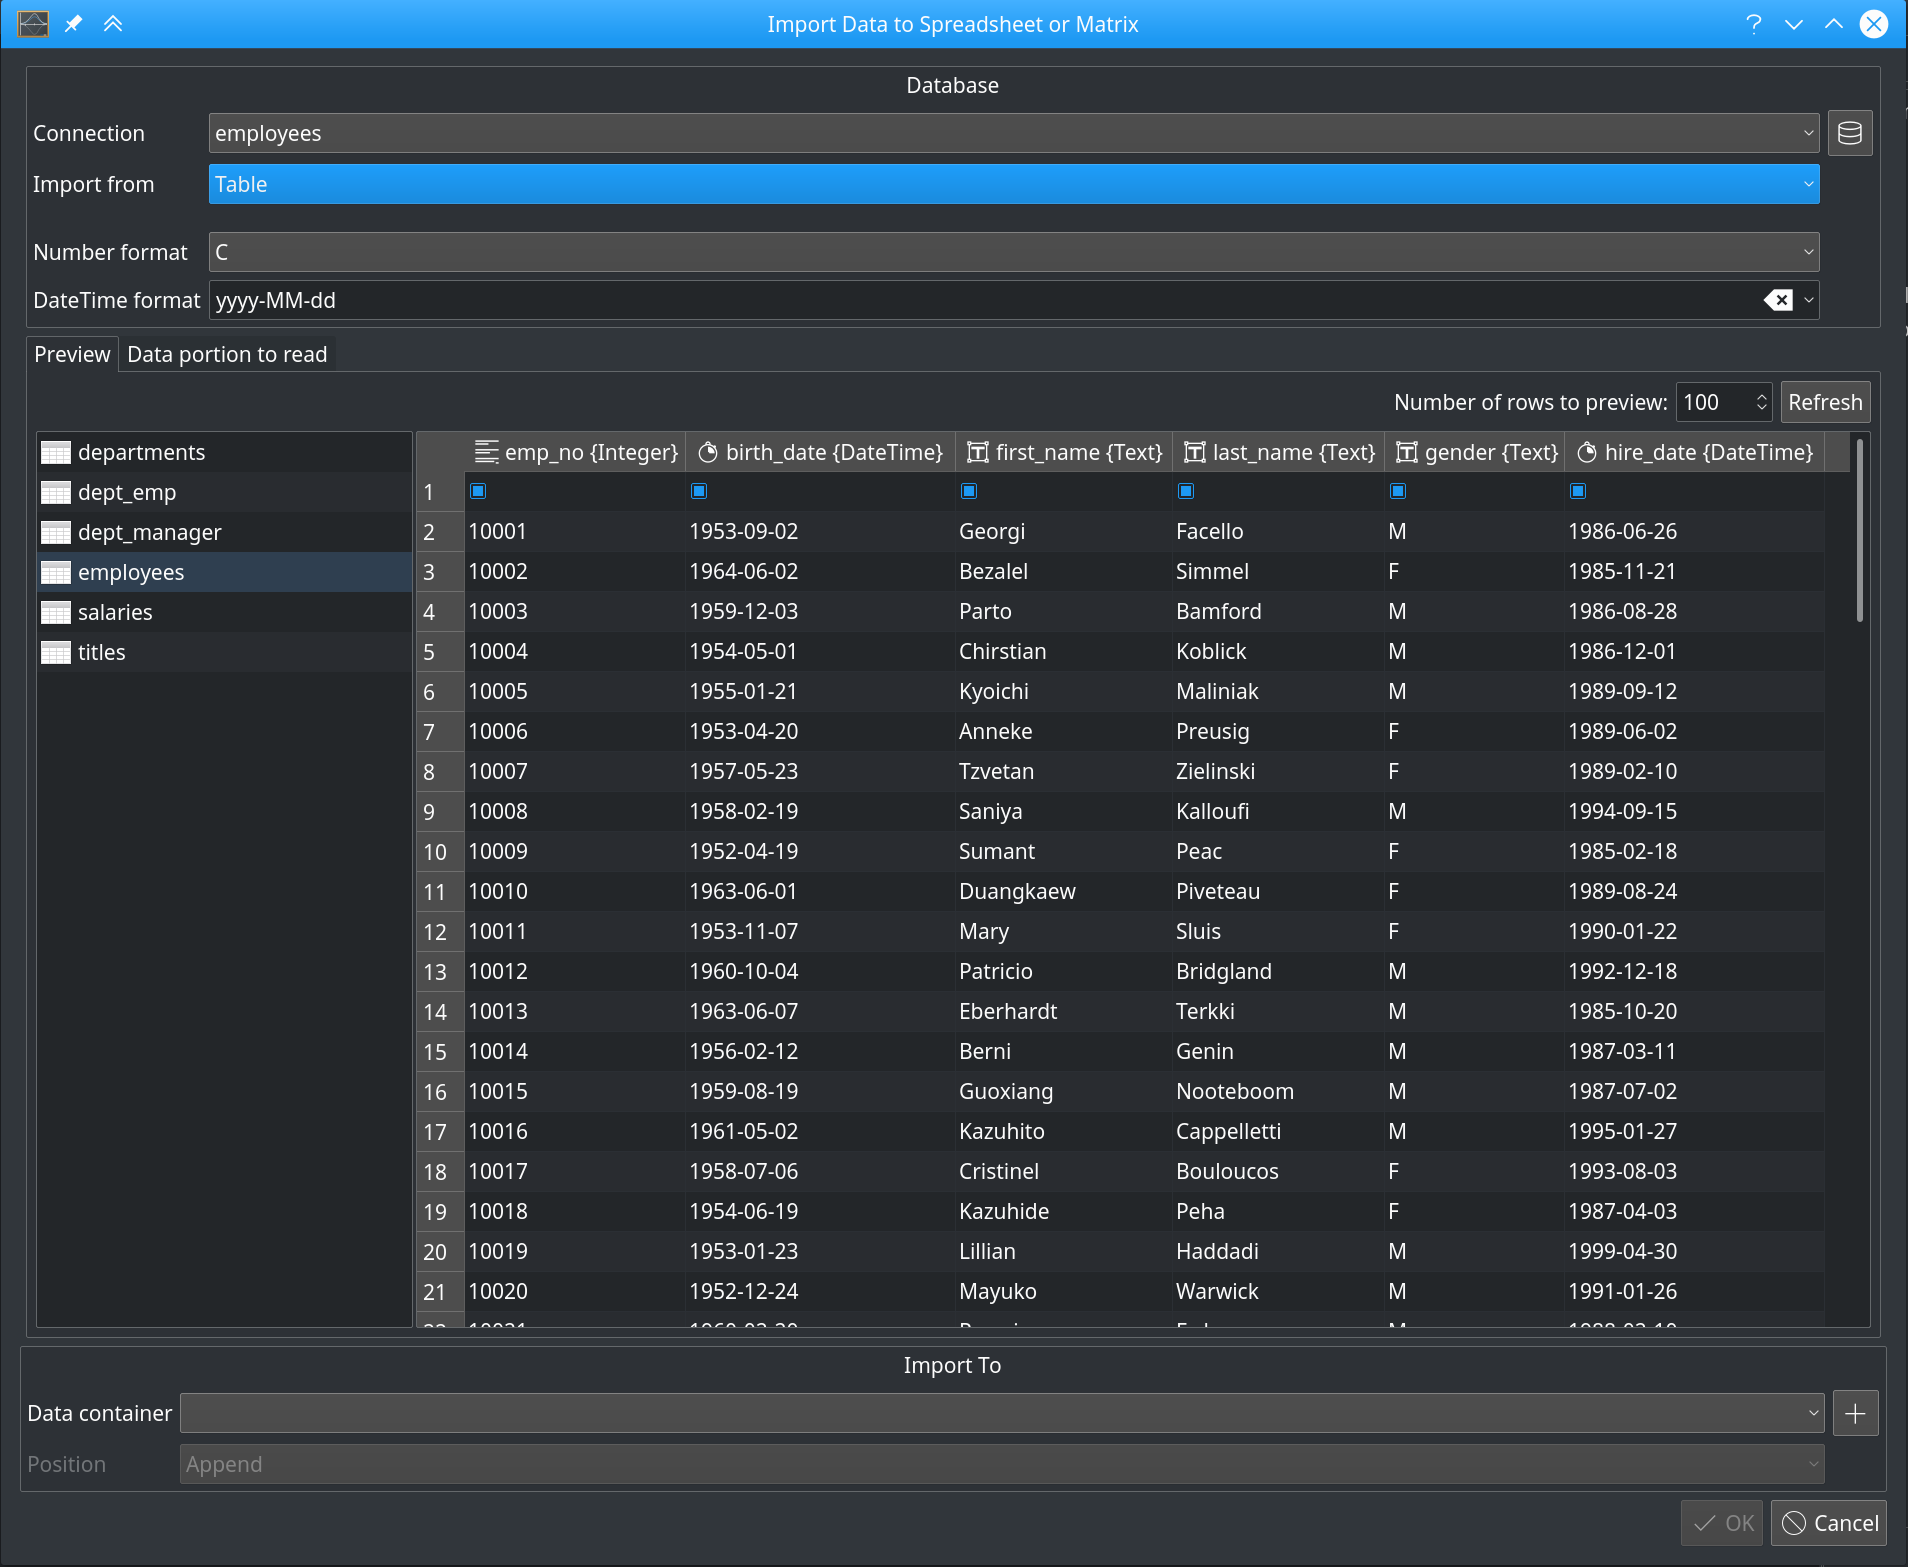
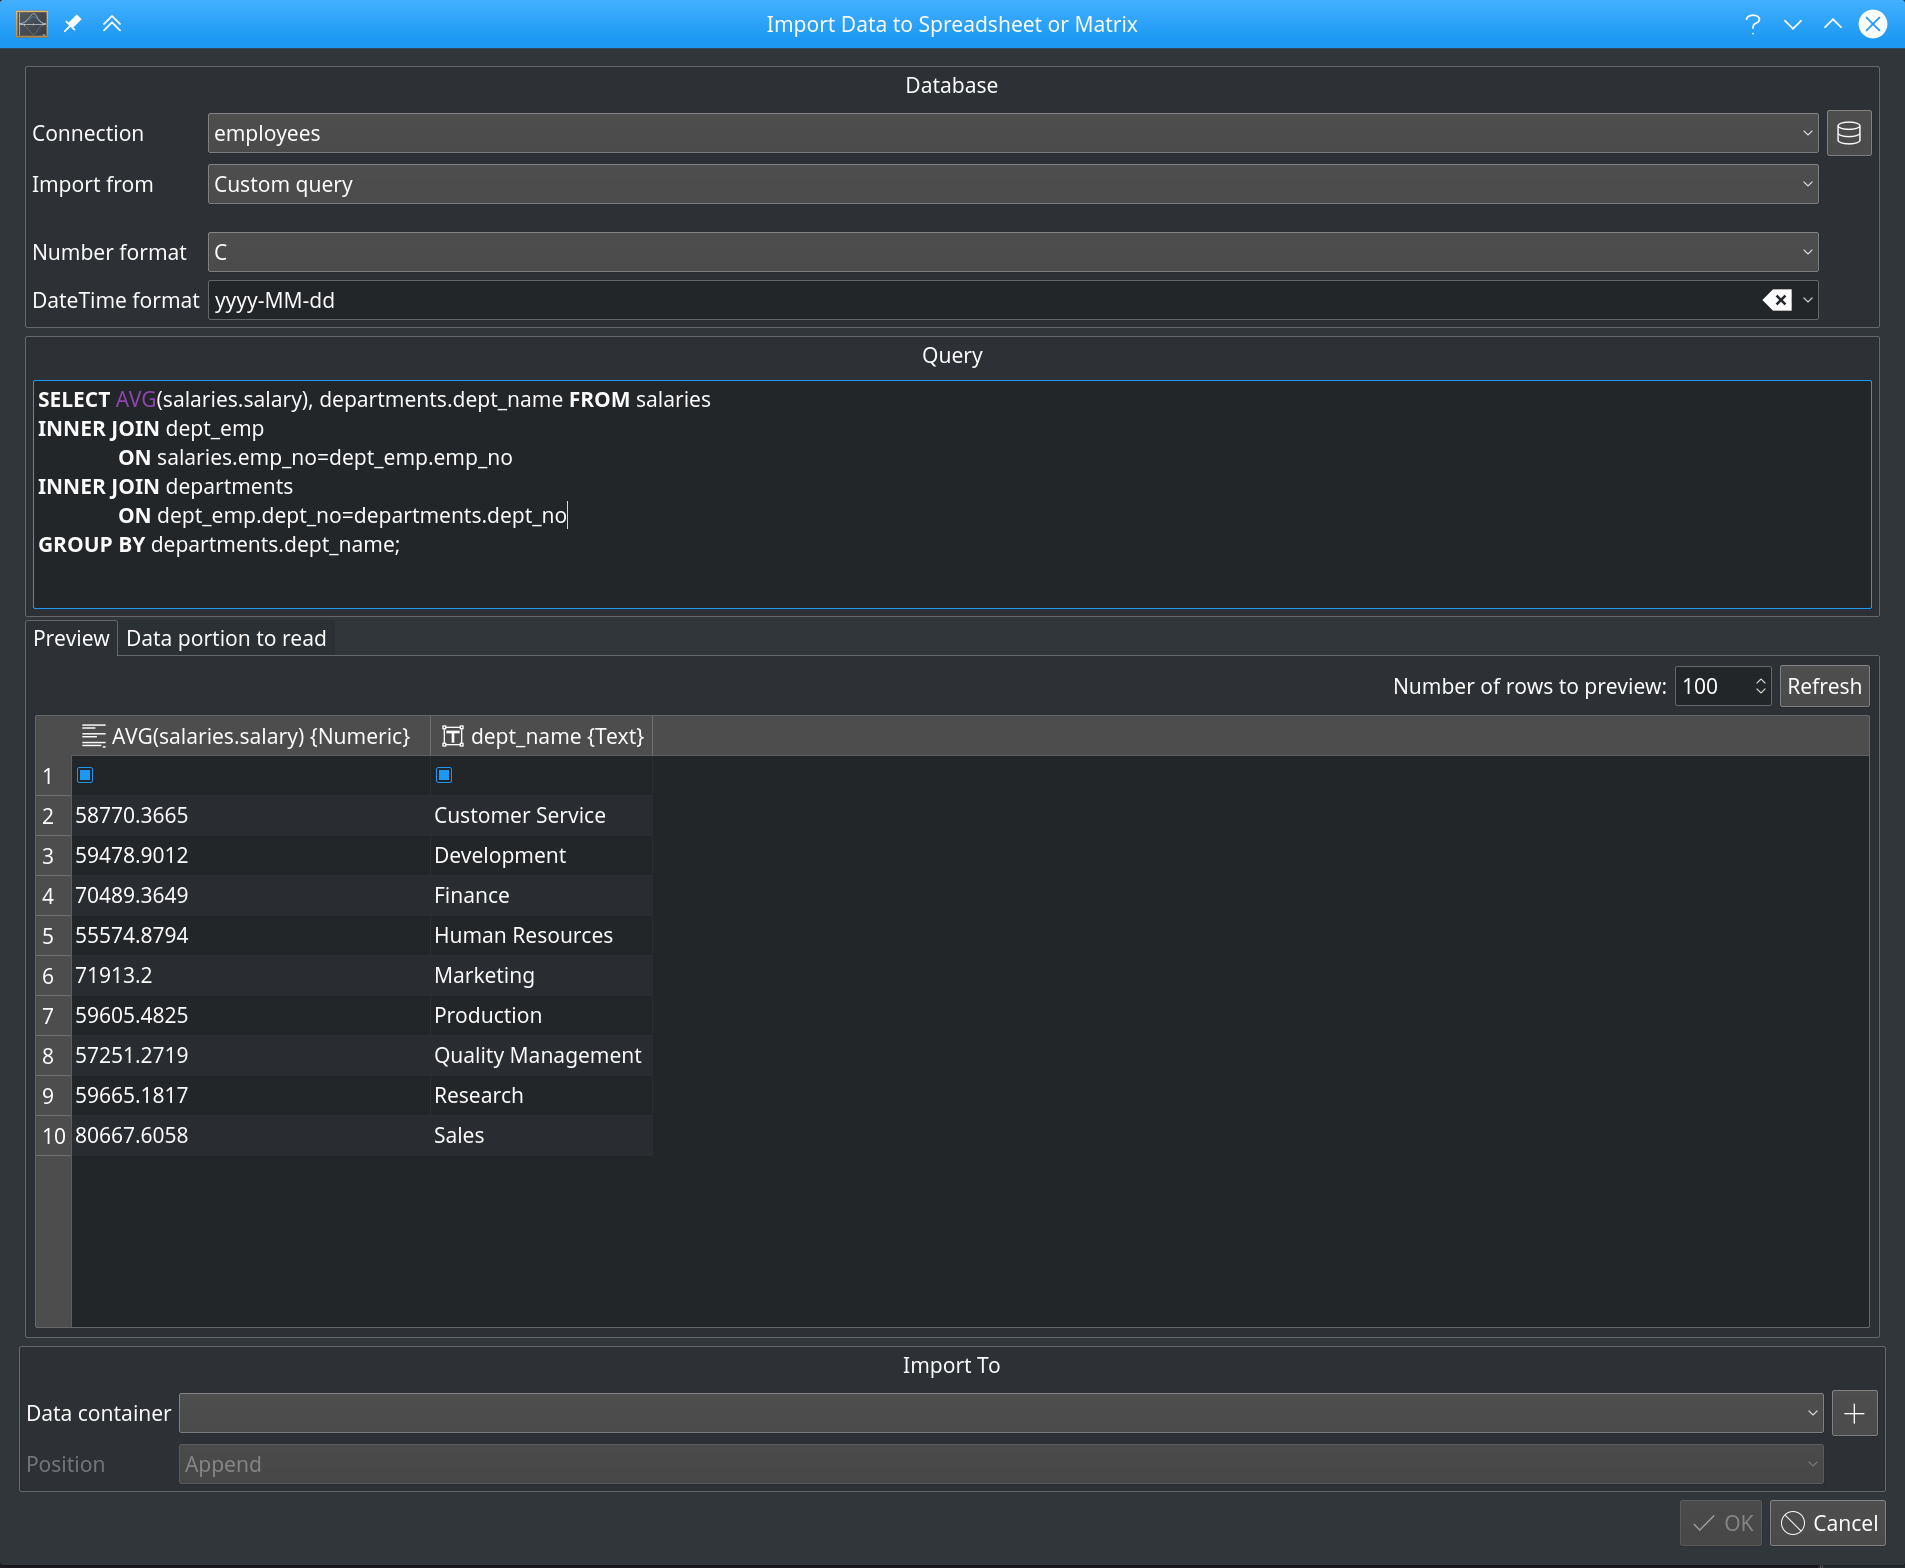
The dialog supports the user with the navigation through the available database tables and with a preview of the table data. In addition to importing a certain database table (complete or by limiting the number of rows to be imported), the user can define an arbitrary custom query and import its result set:
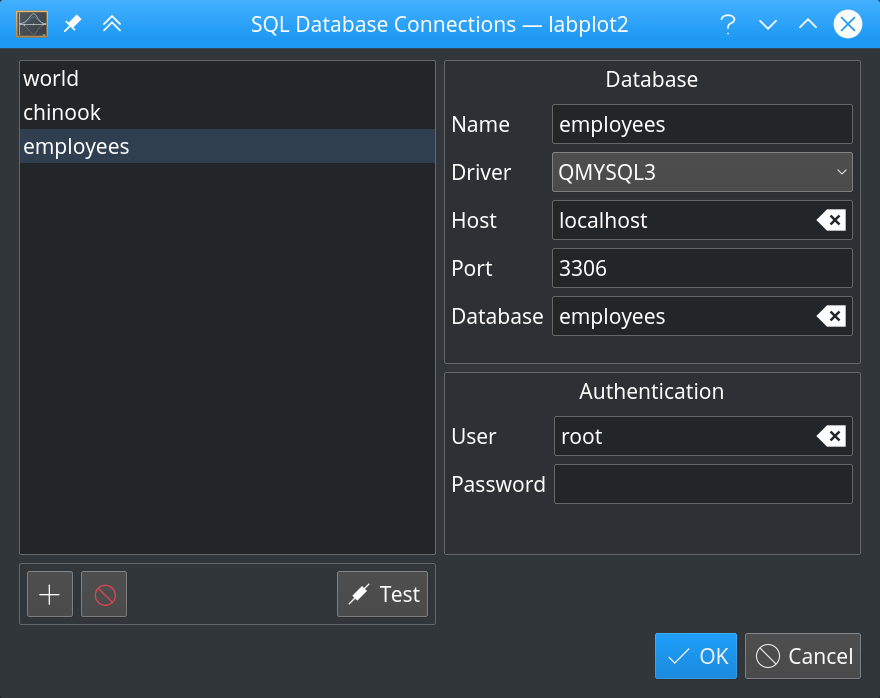
To manage the connections to different databases we implemented “Connection Manager”. Once a connection is configured and saved, the user can select it in the import dialog and proceed with the selection and the import of data without the need to go through the configuration to the database again and again:
The next screenshot shows the result of the custom query shown above that was imported into a spreadsheet together with its visualization in a plot in LabPlot:
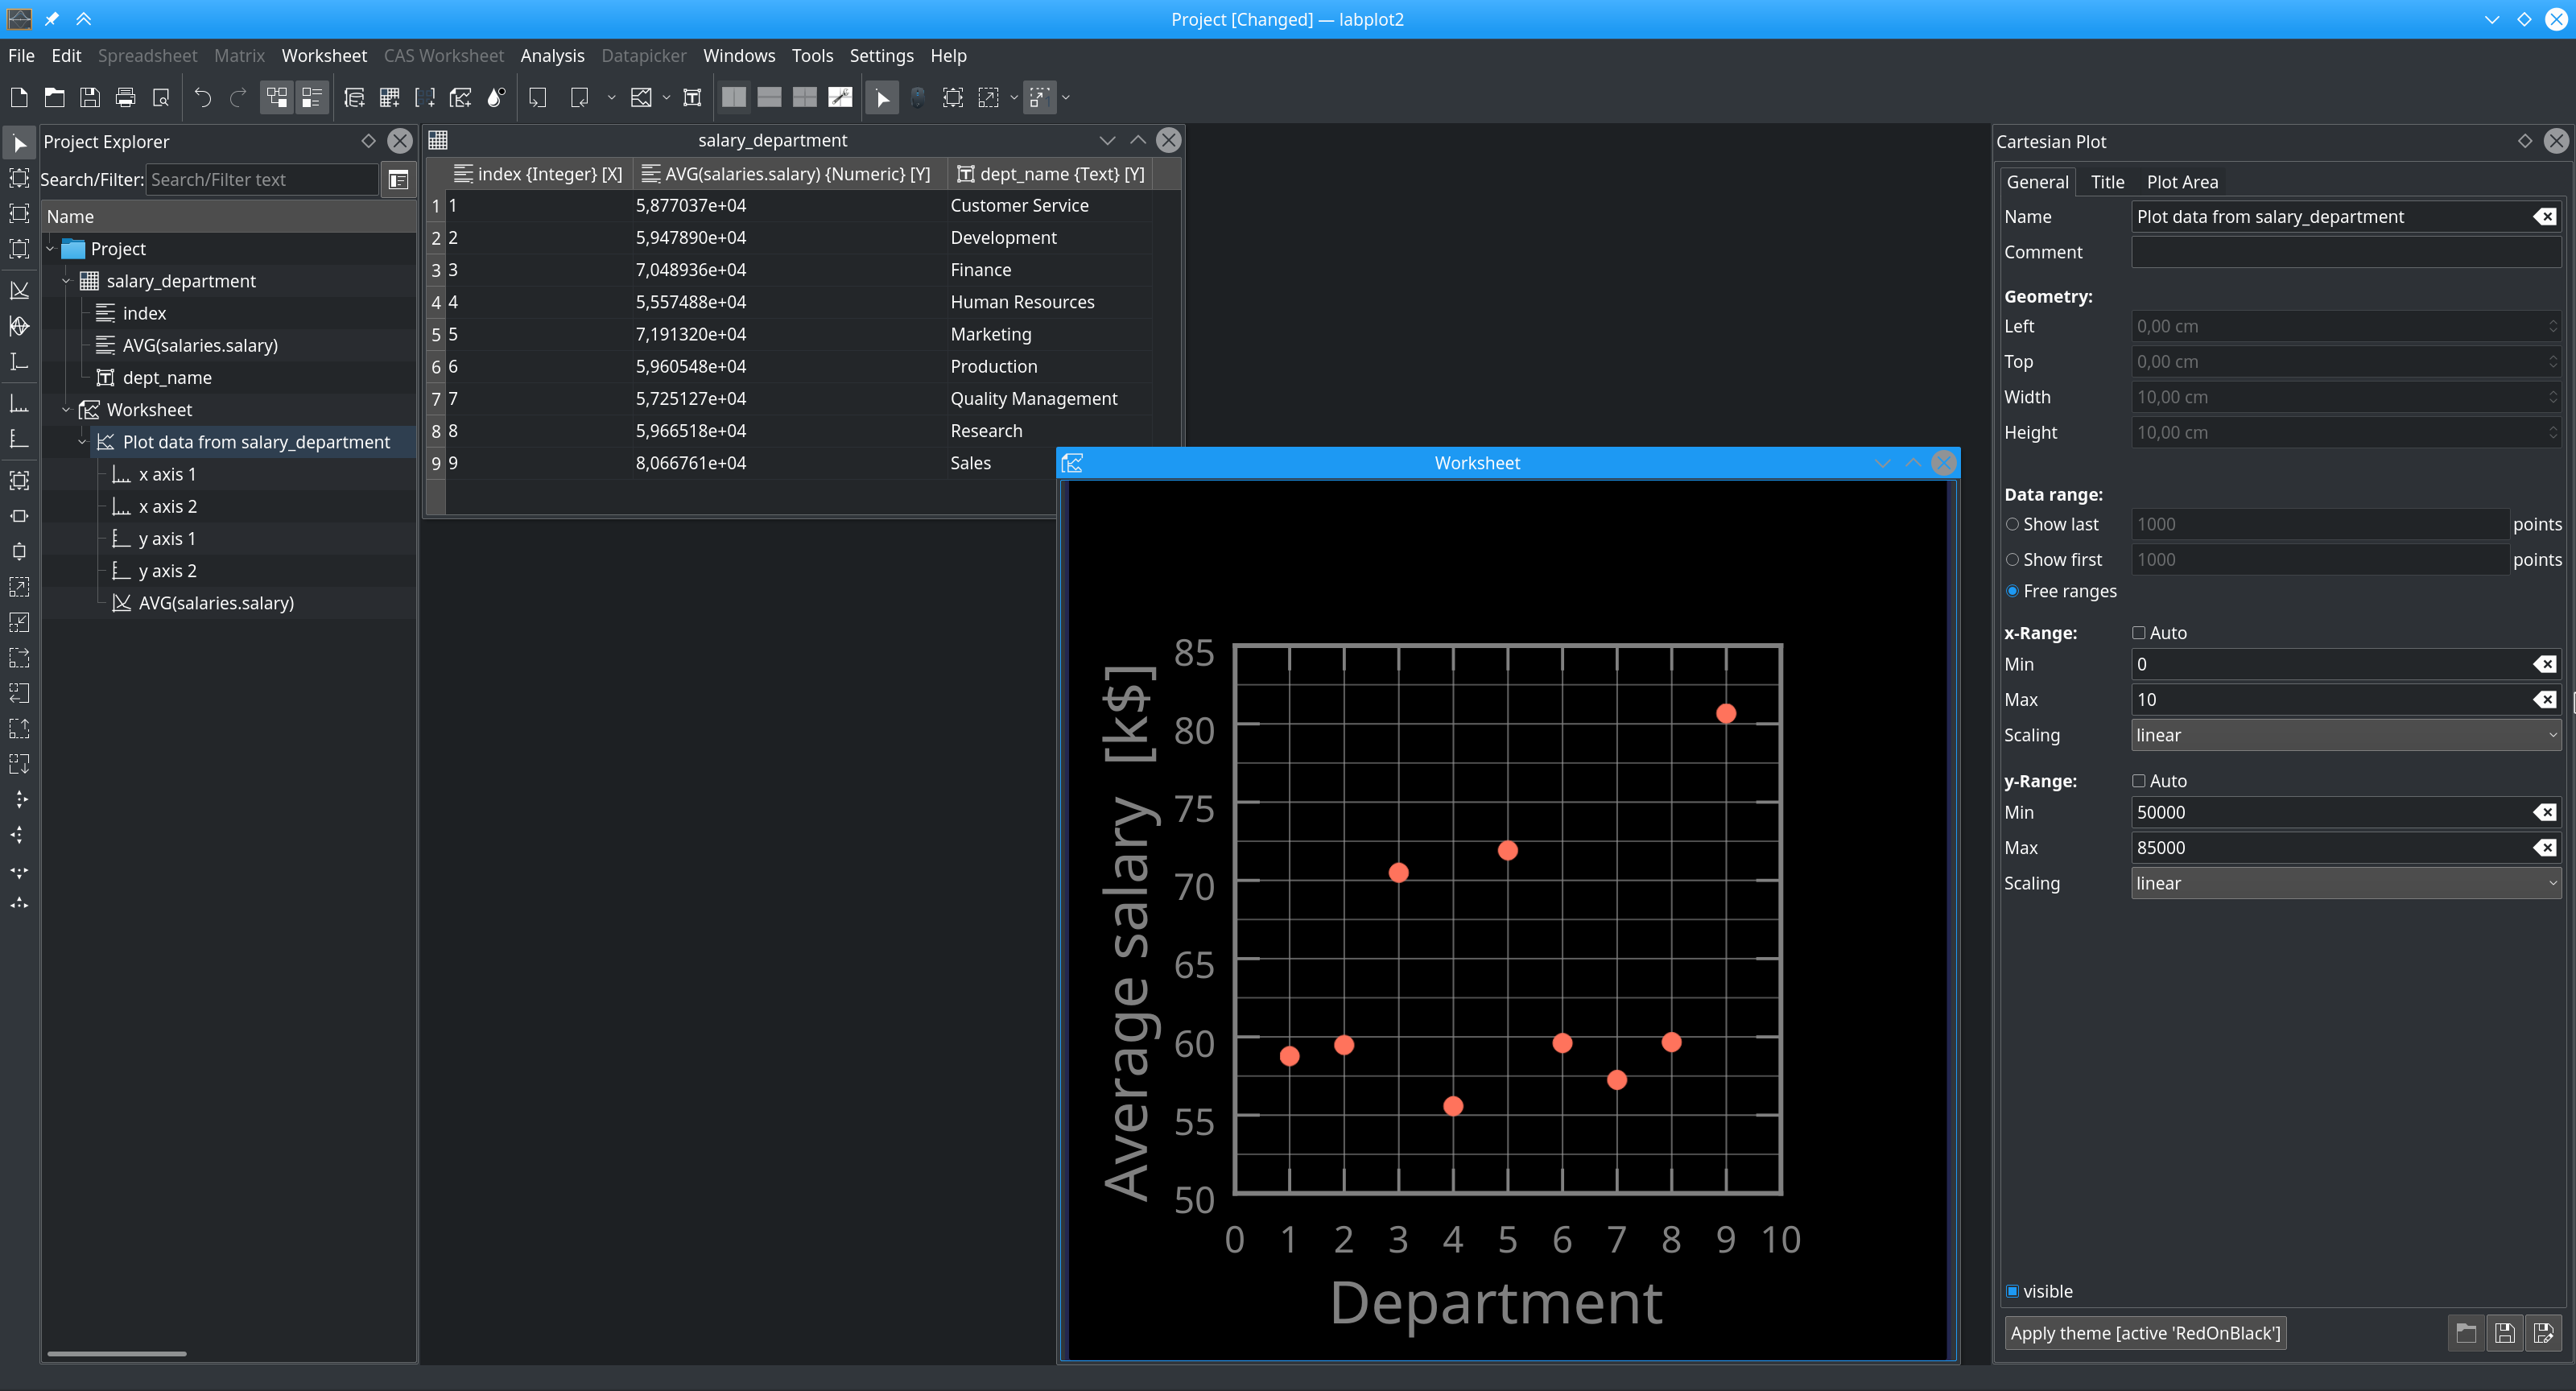
The produced plot also shows one of the current limitations in LabPlot which was very numeric data centric up to now and doesn’t provide enough features to work with categorical data yet. In order to plot such data, LabPlot user has to manually generate an additional “index” prior to plot the data. Also, wouldn’t it be nice to have the names of the departments instead of the index integers on the x-axis in such a plot? These issues are being addressed already and we’ll be in a much better shape with regard to the support of categorical variables in the next release.
In parallel, we work within a GSoC2017 project on the support for live data which will also include reading from different devices (files, pipes, local and network sockets, serial port). We’ll try to finalize this for the next release, too. With the new support of SQL databases and with the results of the mentioned GSoC2017 project, LabPlot 2.5 is going to support a much bigger variety of different data sources!