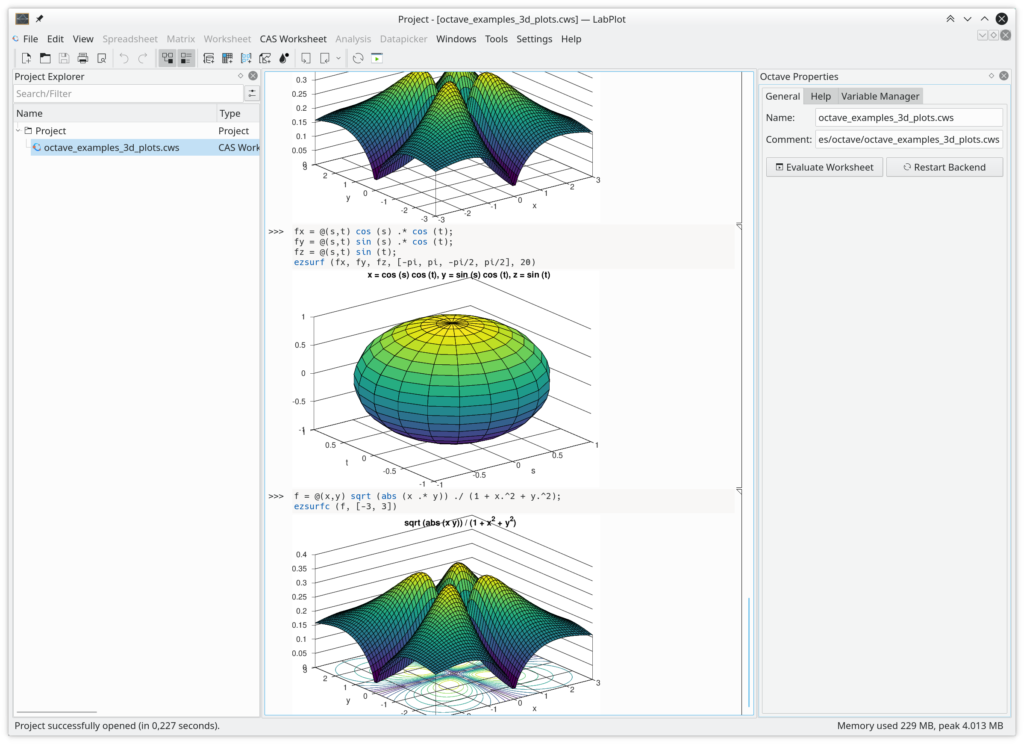
Jupyter and Cantor Projects
Jupyter project files In the recent release of Cantor – KDE Frontend to mathematical applications – the support for Jupyter notebook format was announced. To cite from Cantor’s release announcement: Jupyter is a a very popular open-source web-based application that provides an interactive environment for…
Reference lines and image elements
We continue working on the plotting capabilities of LabPlot. In the next release we will be adding two new worksheet objects to provide more flexibility and features to create attractive looking visualizations. In this short blog post we want to report on this recent development….

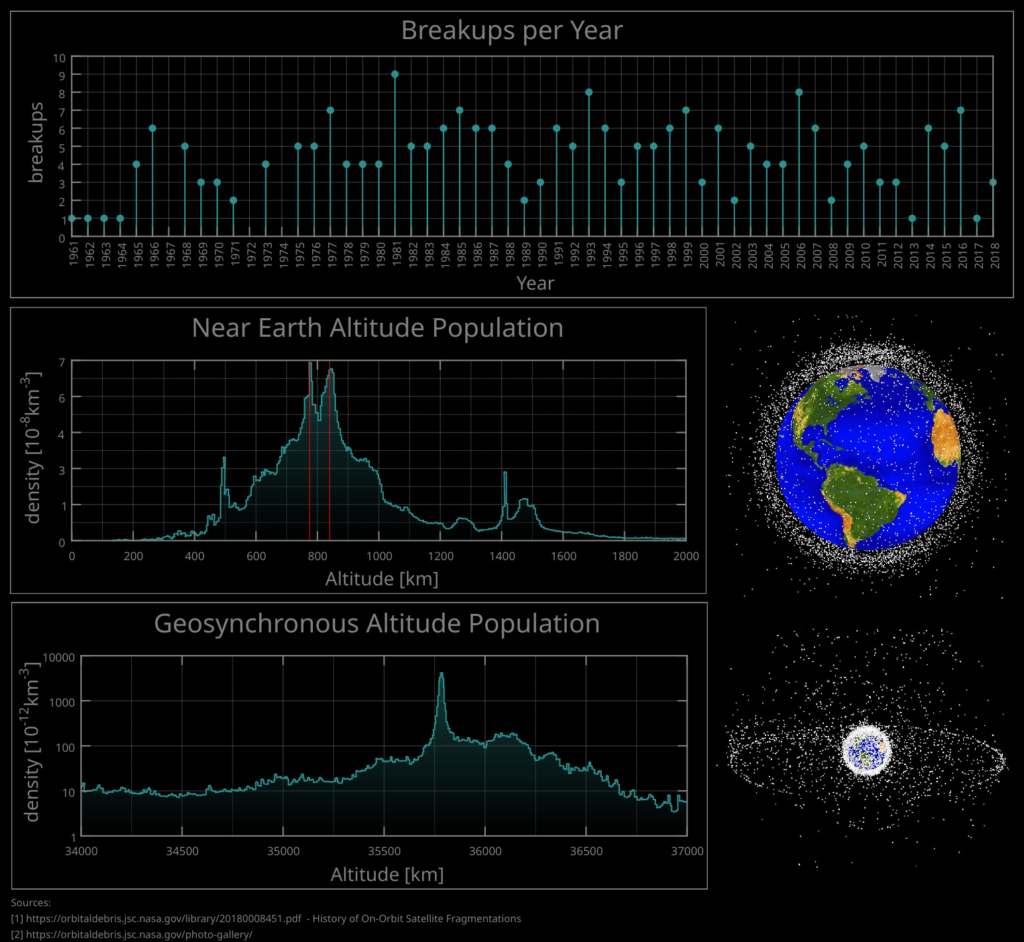
Educational Data Sets
There are many online sources available that provide data sets for educational and study purposes. They cover many different areas (physics, statistics, medicine, etc.) and many tools and frameworks provide wrappers for them and allow you to easily play around with the data sets. In…
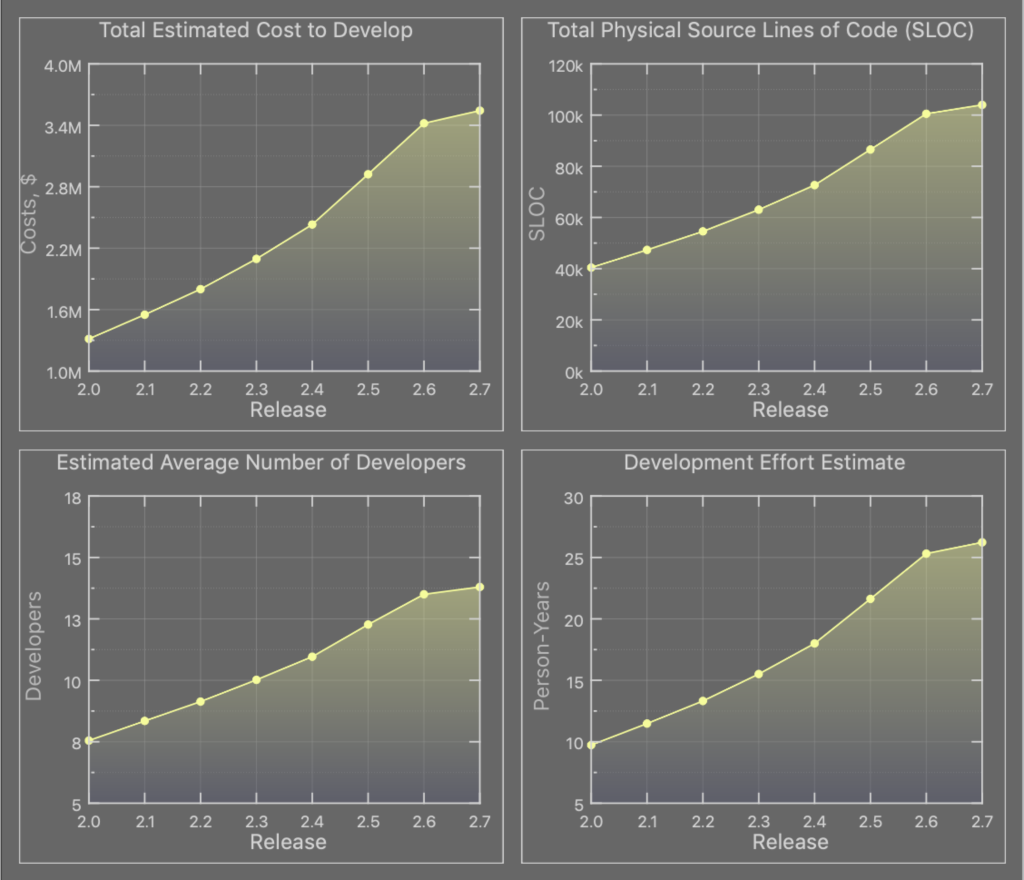
(sloccount-/git-) History of LabPlot
After the recent release was finalized, there is some time now to have a (very) short break in the development, to take care of some organizational topics around the project and to set the development priorities for the next release. But there is also some…
LabPlot 2.7 released
We are happy to announce the release of LabPlot 2.7. The biggest effort in this version went into improving the user experience to make working with LabPlot easier and fun. Spreadsheet The Spreadsheet is where plots get data from. It consists usually of columns containing…
Chocolatey package for LabPlot available
While we’re spending quite some time now finalizing the next release of LabPlot which will be announced soon, we continue getting feedback from our users and we try to incorporate as much as possible into the upcoming release. This feedback usually consists of different discussions…
Cantor 19.08
Since the last year the development in Cantor is keeping quite a good momentum. After many new features and stabilization work done in the 18.12 release, see this blog post for an overview, we continued to work on improving the application in 19.04. Today the…
LabPlot 2.6 released
We are happy to announce the next release of LabPlot! As usual, in the release announcement we want to introduce the major points in the new release. Some of the new developments were already described in the previous blog posts were we reported on the…
Cantor 18.12 – KDE way of doing mathematics
Curious to read about Cantor on LabPlot’s homepage? This is easy to explain. Cantor has got quite a lot of development in the last couple of months, also with great contribution from LabPlot developers. There is a close collaboration between these two KDE projects which…
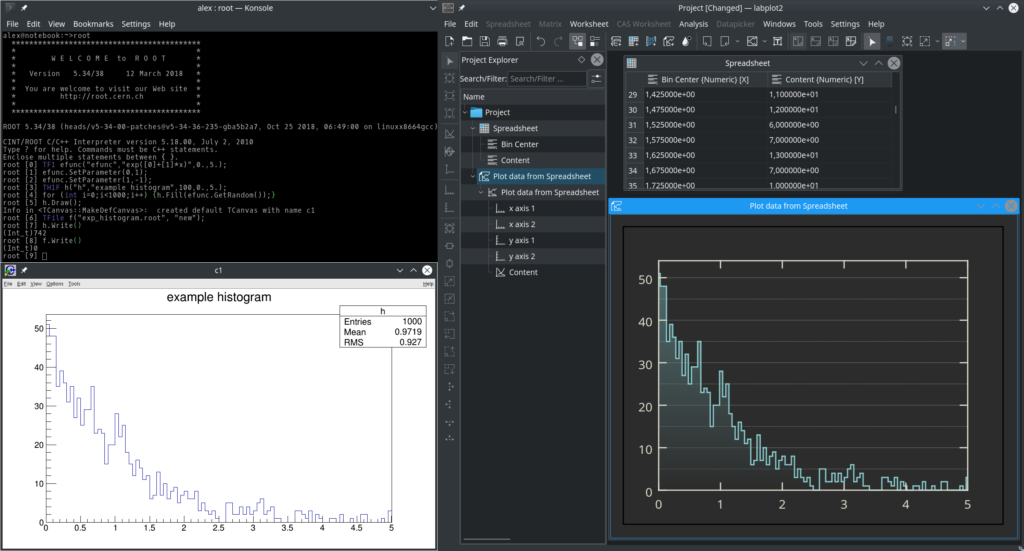
ROOT histograms
In one of the previous blogs we introduced the new capability of LabPlot to calculate and to draw histograms. Given a data set, the user can calculate the histogram using different binning methods and to visualize the calculated histogram in the new plot type “histogram”….