ROOT histograms
In one of the previous blogs we introduced the new capability of LabPlot to calculate and to draw histograms. Given a data set, the user can calculate the histogram using different binning methods and to visualize the calculated histogram in the new plot type “histogram”. A different workflow is given when the histogram was already calculated in another application and the application like LabPlot is just used to visualize the result of such a calculation and to adjust the final appearance of the plot.
Couple of weeks ago Christoph Roick contributed a new input filter for ROOT histograms. ROOT is a computational environment developed at CERN that is used for data processing, statistical analysis and data visualization, mainly for purposes in the high energy physics community. With the new import filter it is possible now to import ROOT histogram files (custom binary format, compressed) into LabPlot:
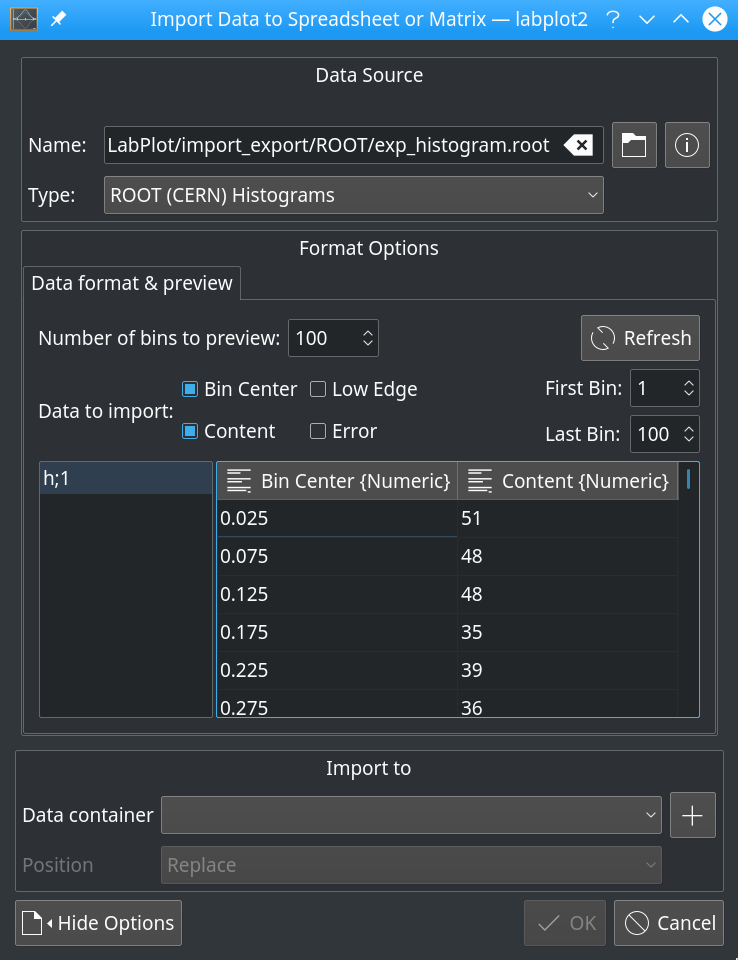
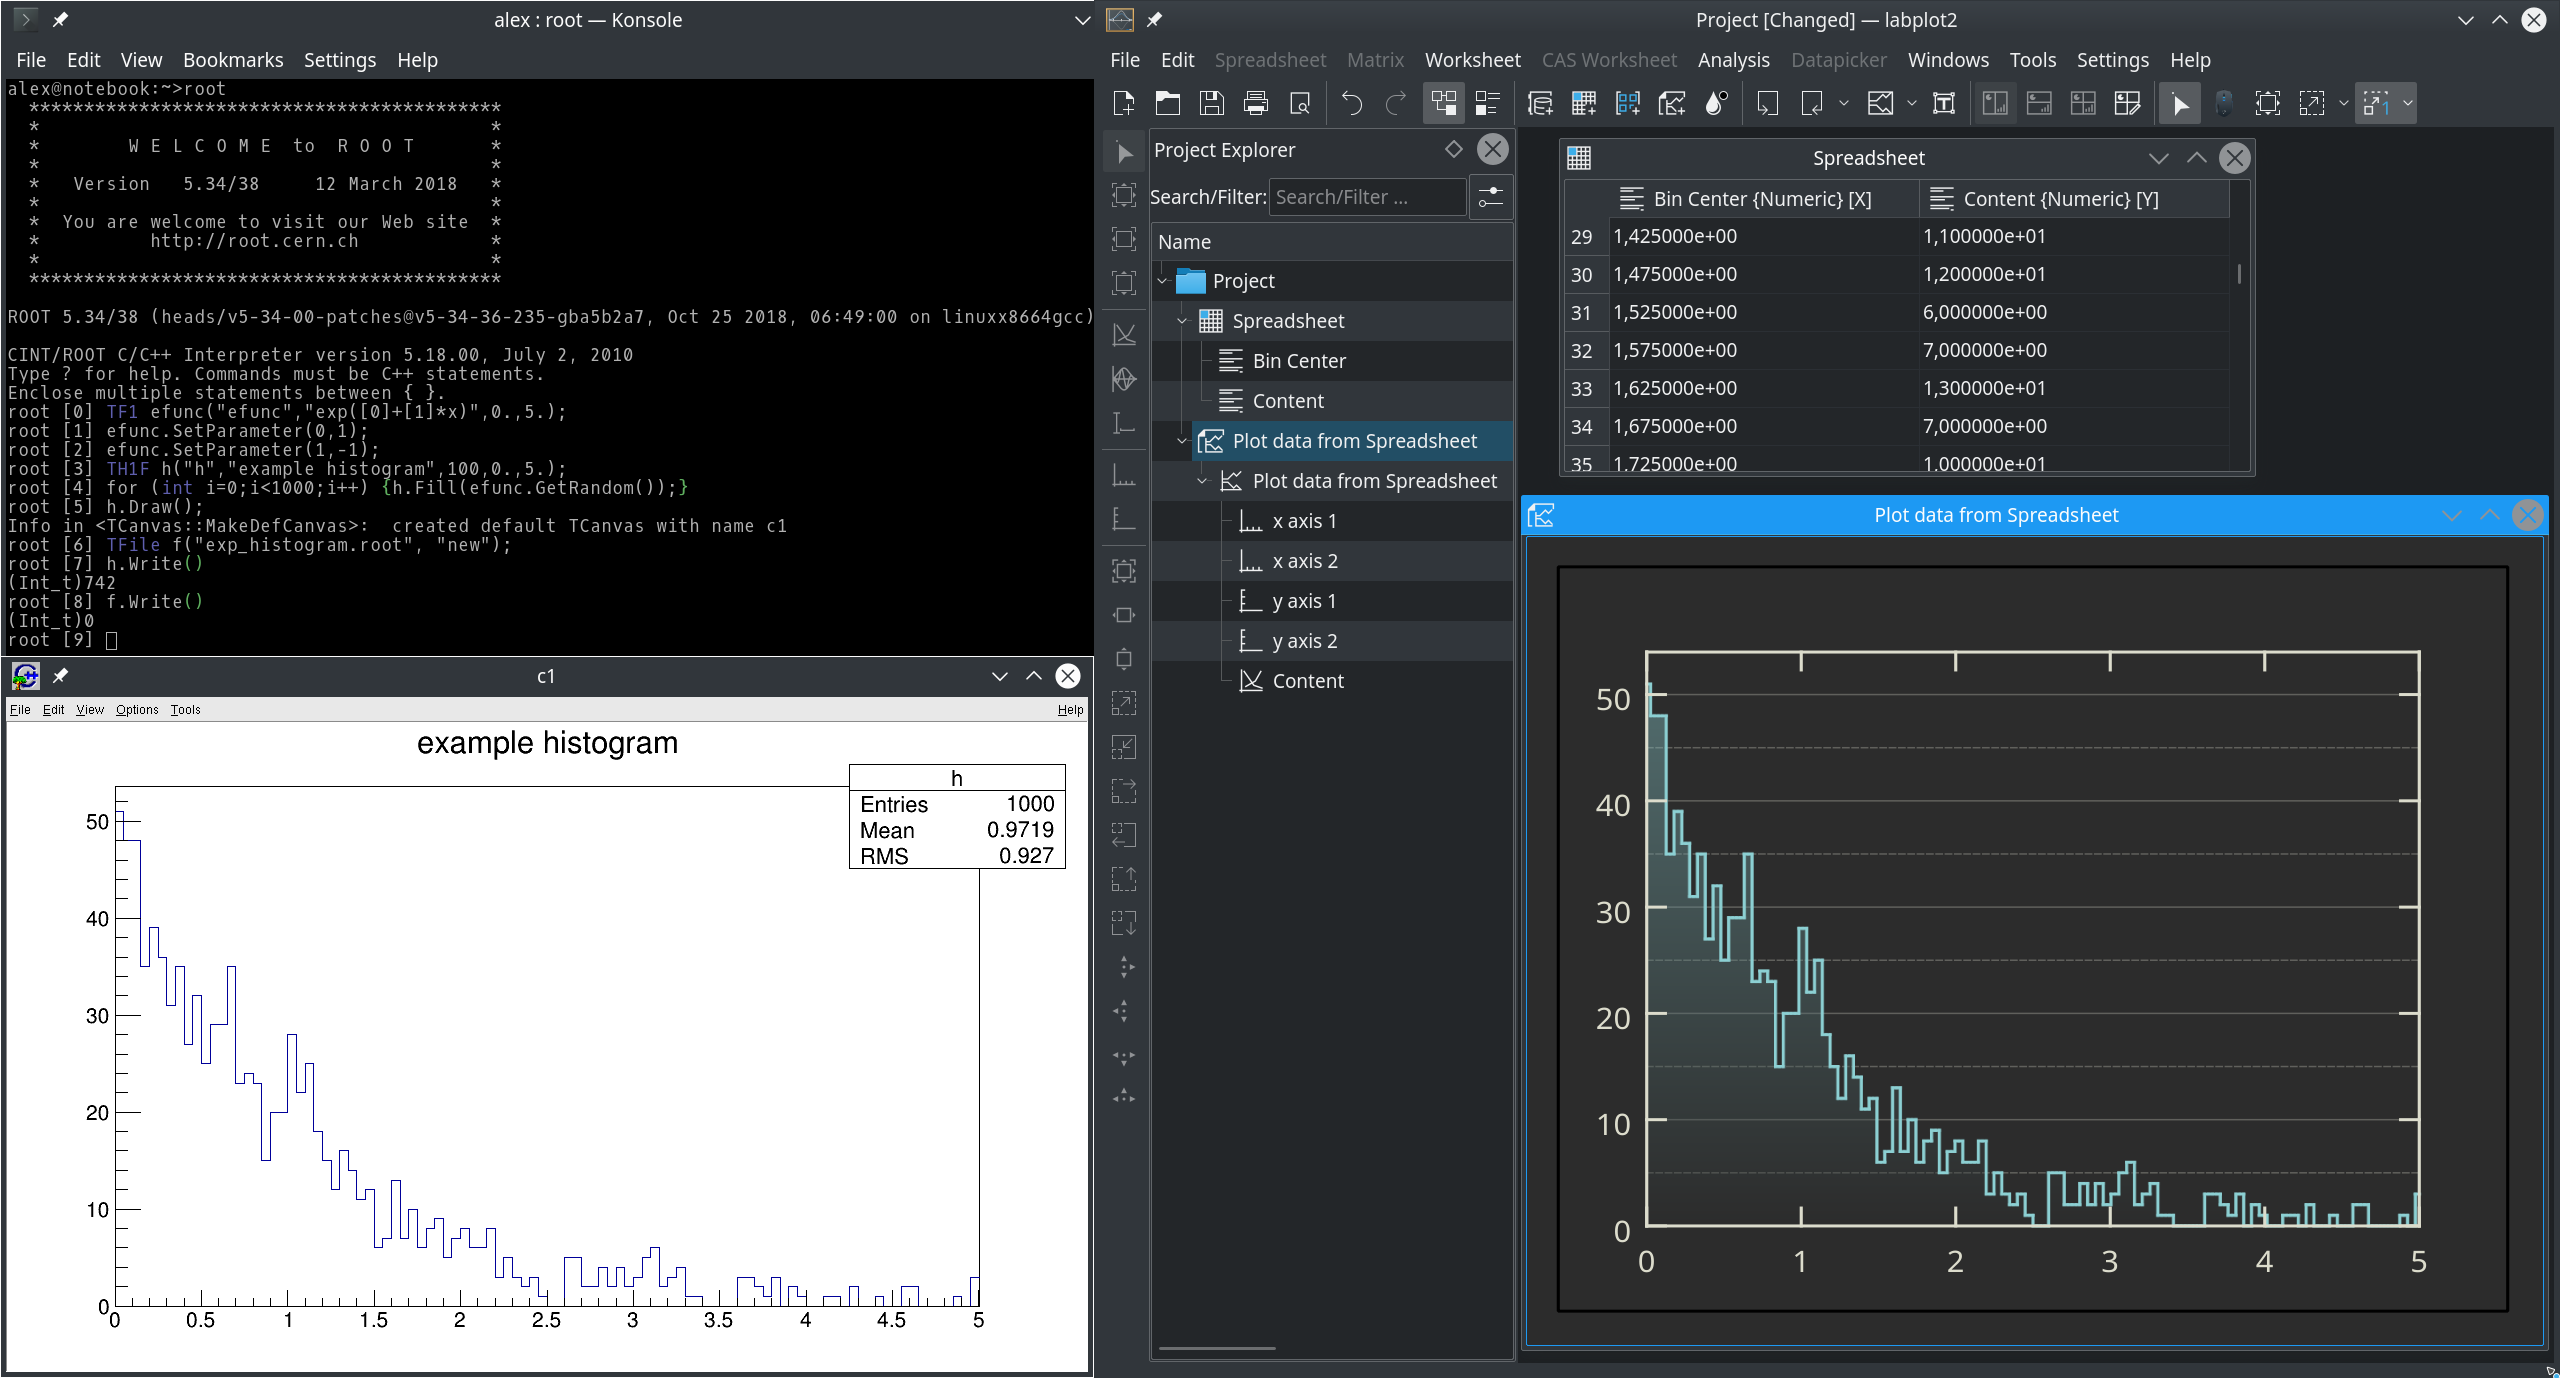
In the import dialog the user can specify which data to import. After the import, the data from “bin center” or from “low edge” can be used together with the bin values from the “content” for x- and y-values, respectively, to plot the data. The result of such a workflow is shown in the screenshot below by means of a very simple example:

In this example taken from ROOT Guide for Beginners, 1000 values for the exponential function are created in ROOT and the histogram is calculated and written to a file. The import of data and the visualization are done in LabPlot as described above. Here, the imported x-y pairs are connected by the “step line” in order to get the common shape of the histogram. Other visualizations with symbols only, etc. are possible, of course, too. The plot on the left hand side was created by the built-in plotter of ROOT and is shown here for comparison purposes.
With this new feature we can utilize the power and speed of ROOT and its ability to work with very big amount of data and to use the flexibility of LabPlot to style the visualization of the calculated data. The code has reached master already and we are going to ship this new feature in the upcoming release 2.6 LabPlot.
In parallel, the work to support also the more general data container “tree” in ROOT is already in progress and we hope to finalize it soon. This would further extend the application area of LabPlot in near future.
That’s awesome! As a physics student I’m used to use a lot of ROOT capabilities, especially in C++ or with the Python bindings and that not only particularly in particle physics. I am definitely going to try it out and perhaps to also integrate it into my workflow! Thanks! 🙂