Import of JSON and ngspice files
We continue adding support for more data formats that can be imported into LabPlot. As part of the upcoming release we add the support for JSON file and for ngspice raw file format which we want to introduce in this short blog post.
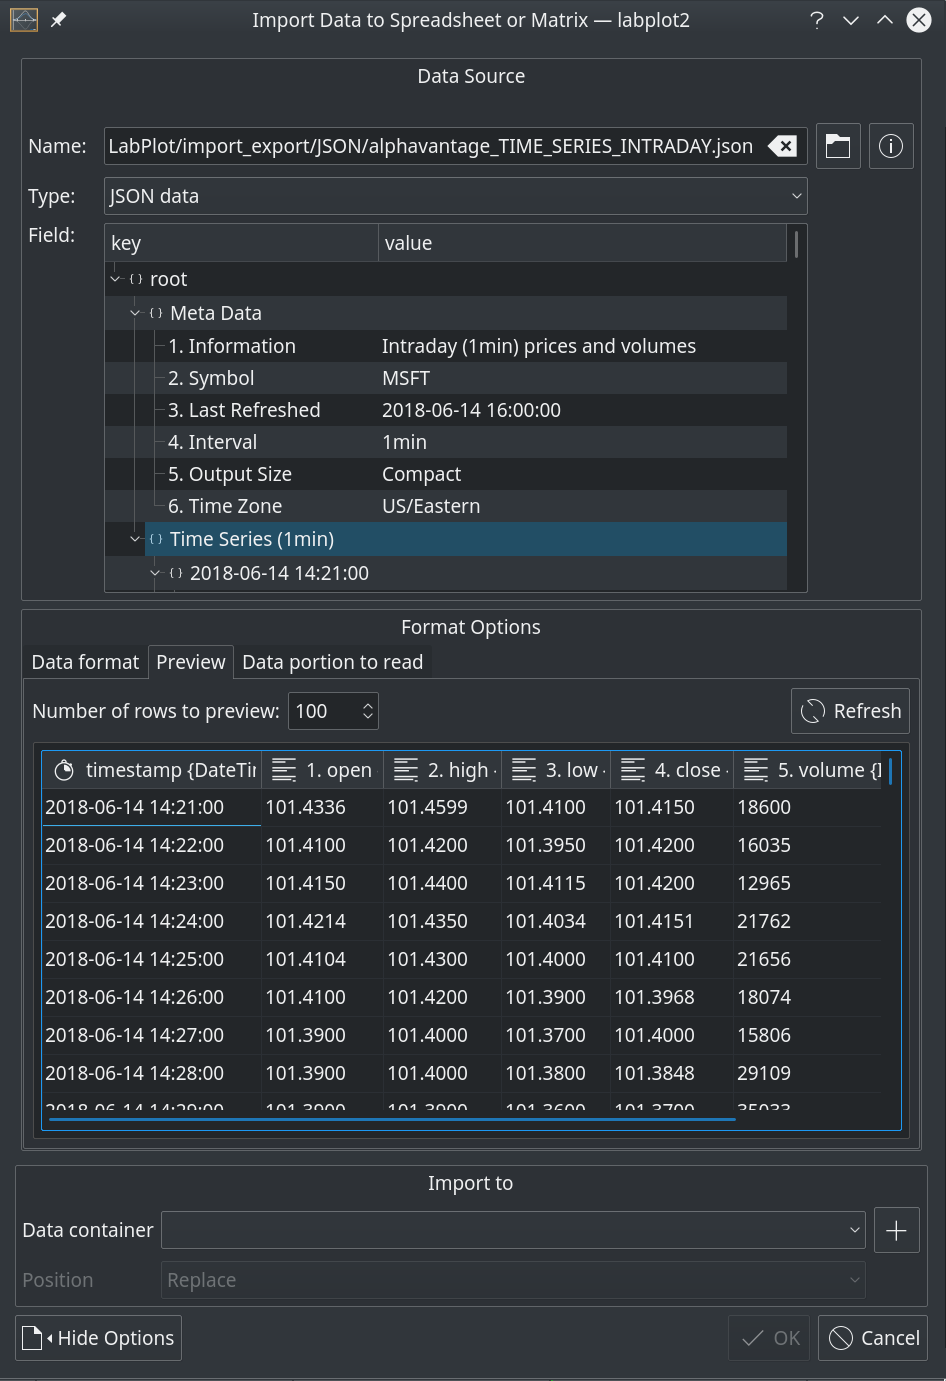
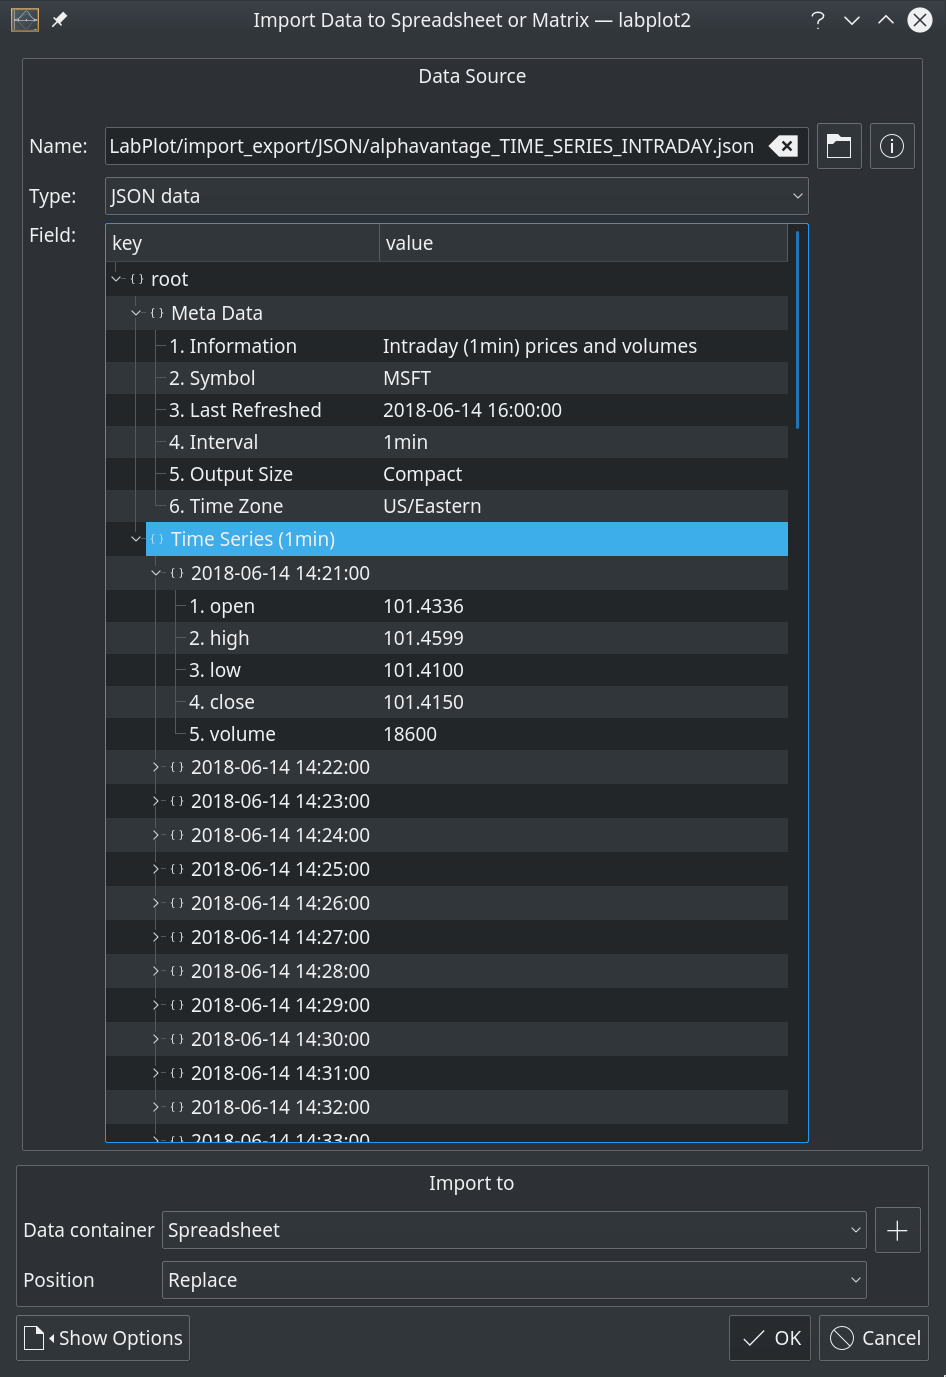
After the selection of a JSON file in the “Import File” dialog, its content is shown in a tree view in a manner that many user will be familiar with from other JSON viewers. The relevant parts in a such a JSON file that one usually wants to visualize are arrays and objects. Once the root element that needs to be imported is selected, LabPlot automatically recognizes its type and the type of its children and generates a two dimensional preview of the data to be imported. This works the same for arrays
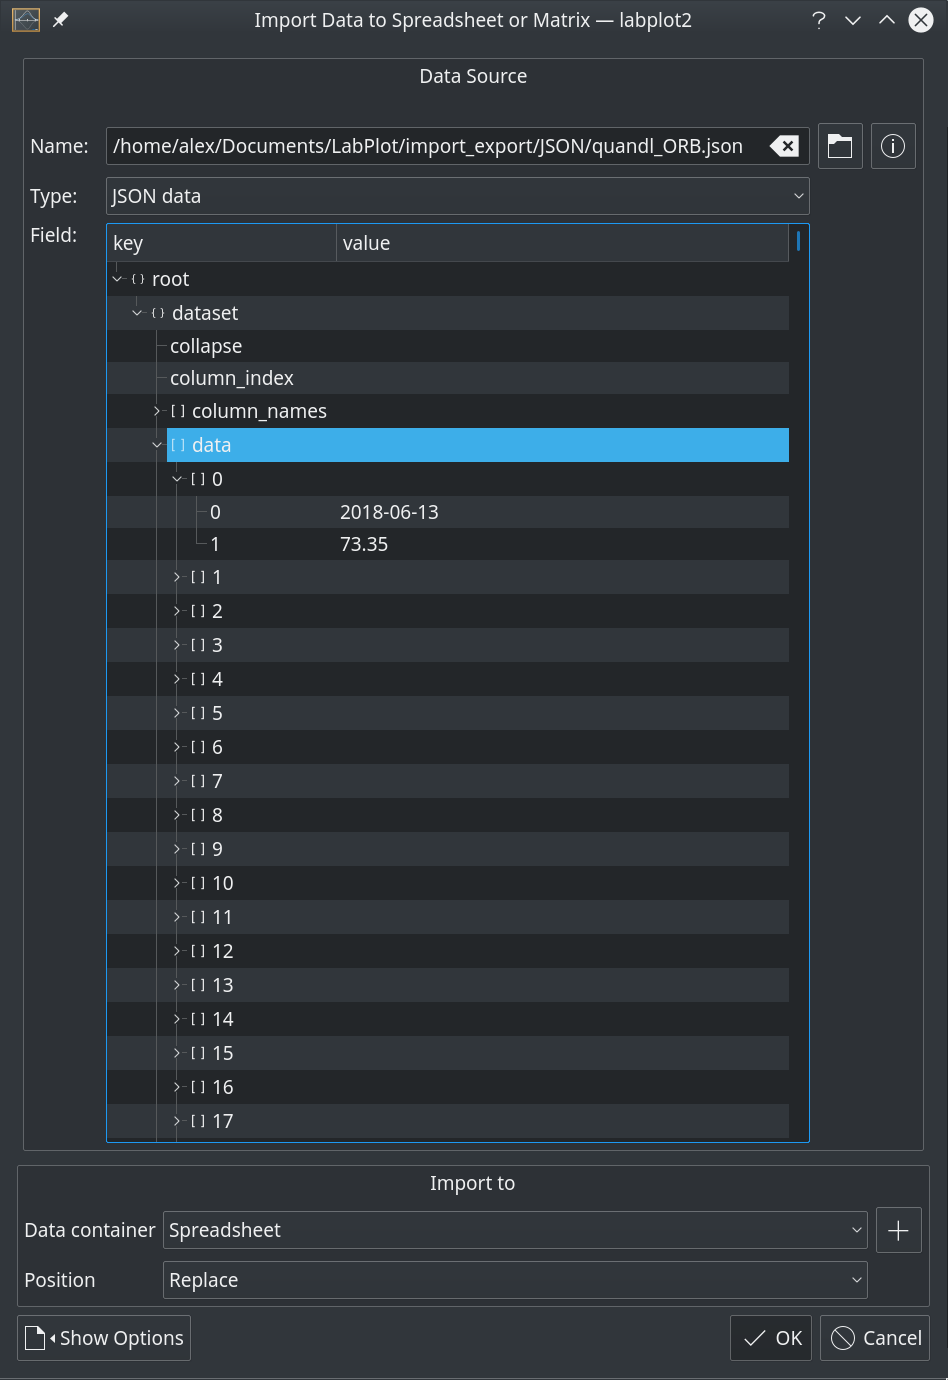
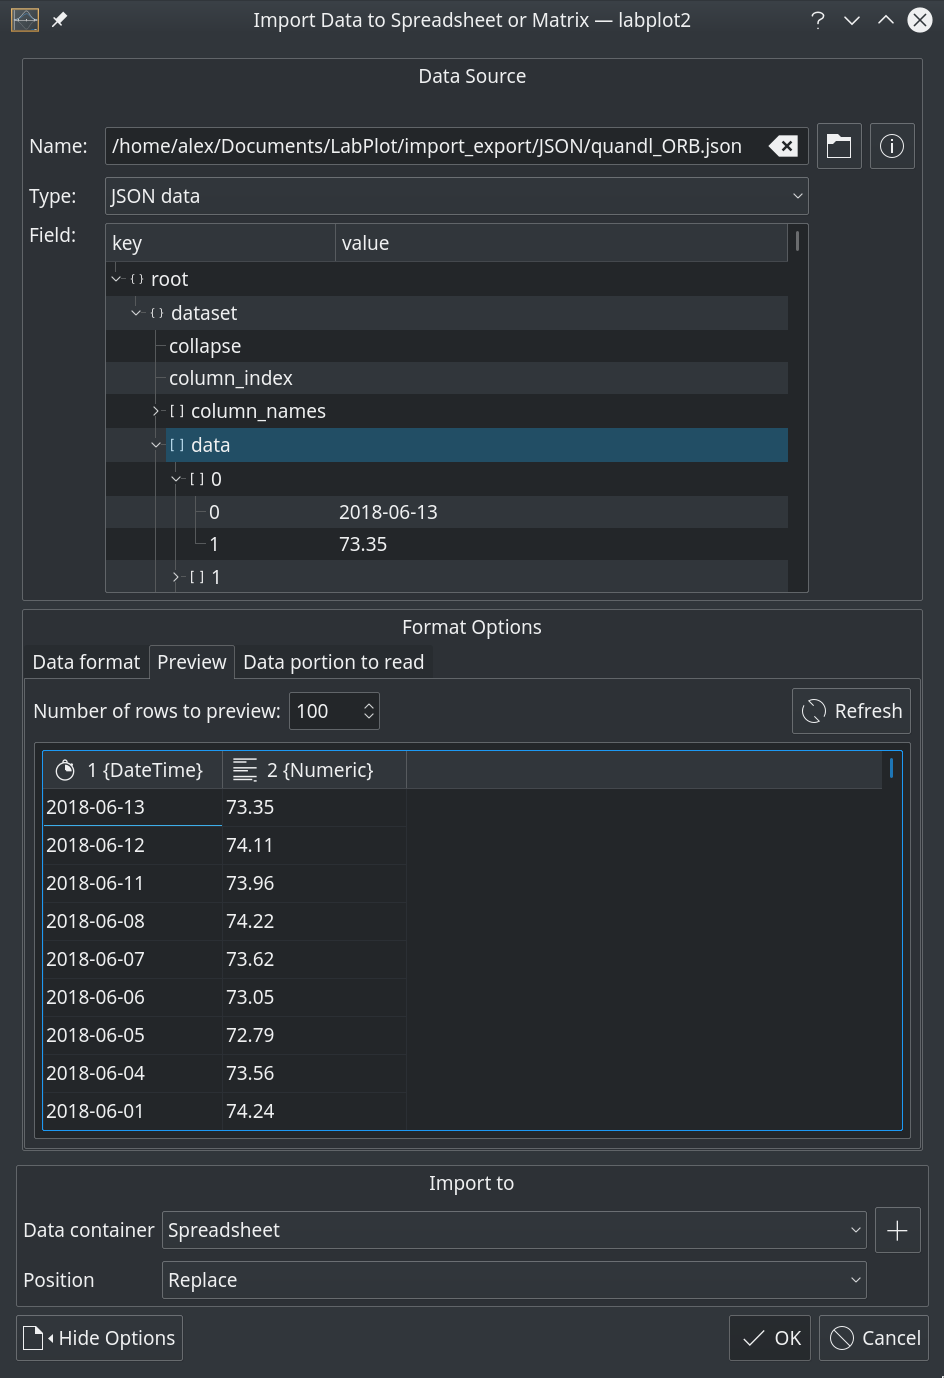
as well as for JSON objects

After such a local file was imported, the plotting of data can be done as usual. The part that is of more practical interest, namely the import of data from online web services like stock prices, weather data, data monitoring services, etc., still needs to be implemented. Such services usually exchange the data in JSON format and the features described above can be considered as the preparational steps also in this direction. This is something for the near future.
In the previous release we made the support for live data available. To demonstrate this feature we used an example based on the results of calculations done in Gnucap – an open-source circuit simulator. The Gnucap simulation was controlled by a small PyQt GUI and the results where written out to an ASCII file which was then consumed by LabPlot (import of live data and its visualization). To further support this community, we decided to add the support for native raw format of ngspice – another open-source application for circuit analysis. We read both flavors of it – binary and ASCII. When opening such a file, LabPlot auto-detects the ngspice raw format and selects the proper import filter.
To demonstrate this, we use a simple circuit consisting of a junction gate field-effect transistor and of two variable voltages – gate-source and drain-source:
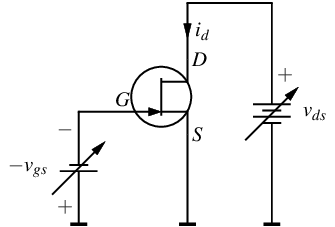
The behavior of such a transistor is usually studied with the help of its “characteristic curves” – the transfer characteristic showing the current as the function of the gain-source voltage and the output characteristic showing the current as the function of the drain-source voltage. This time the calculation is done with ngspice and we read the produced raw files with the new import filter:
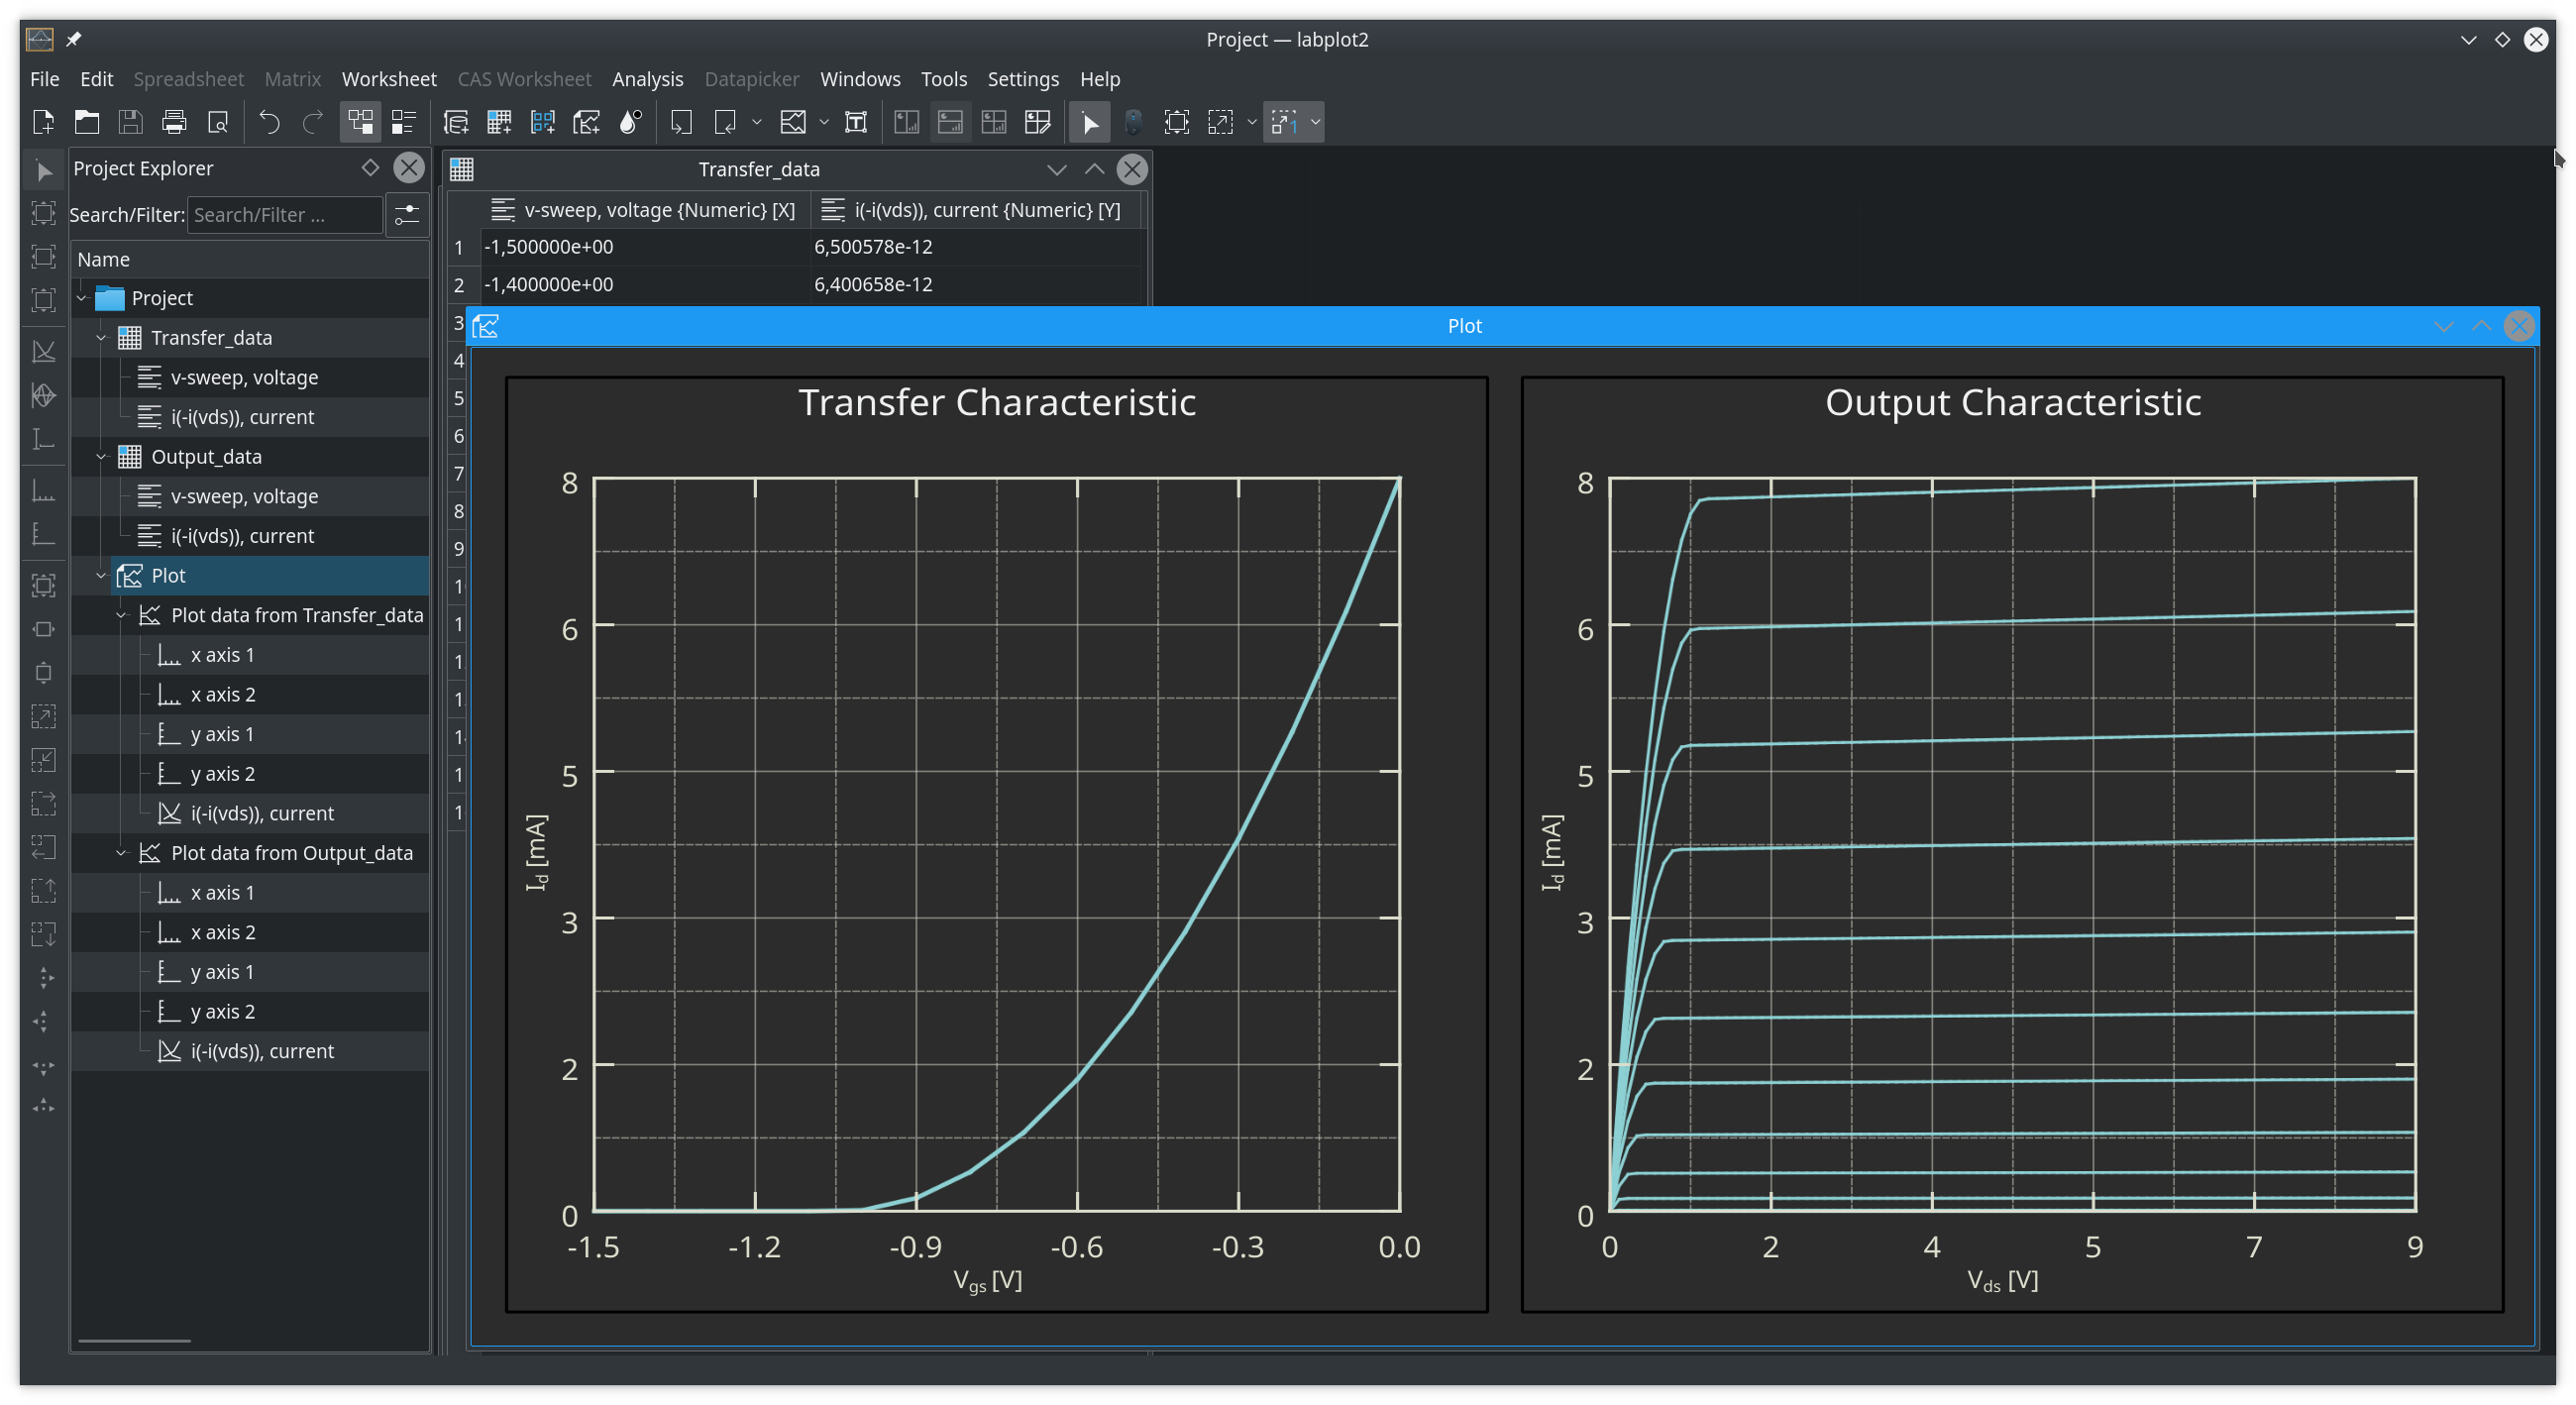
To generate the second plot where a family of Id curves is calculated for different values of Vgs, we had to implement a new feature in LabPlot to allow to only connect points that are monotonically increasing. Since all the curves in this family are put into the same data set, without this options the end points of the lines would have been connected with the origin which is not what the user wants to see for this specific data set.
The idea for this example and the technical input around ngspice was contributed by Orestes Mas from the Technical University of Catalonia.
Great stuff, keep up the good work!