LabPlot
FREE, open source and cross-platform Data Visualization and Analysis software accessible to everyone and trusted by professionals
FEATURE HIGHLIGHTS
What can you expect?

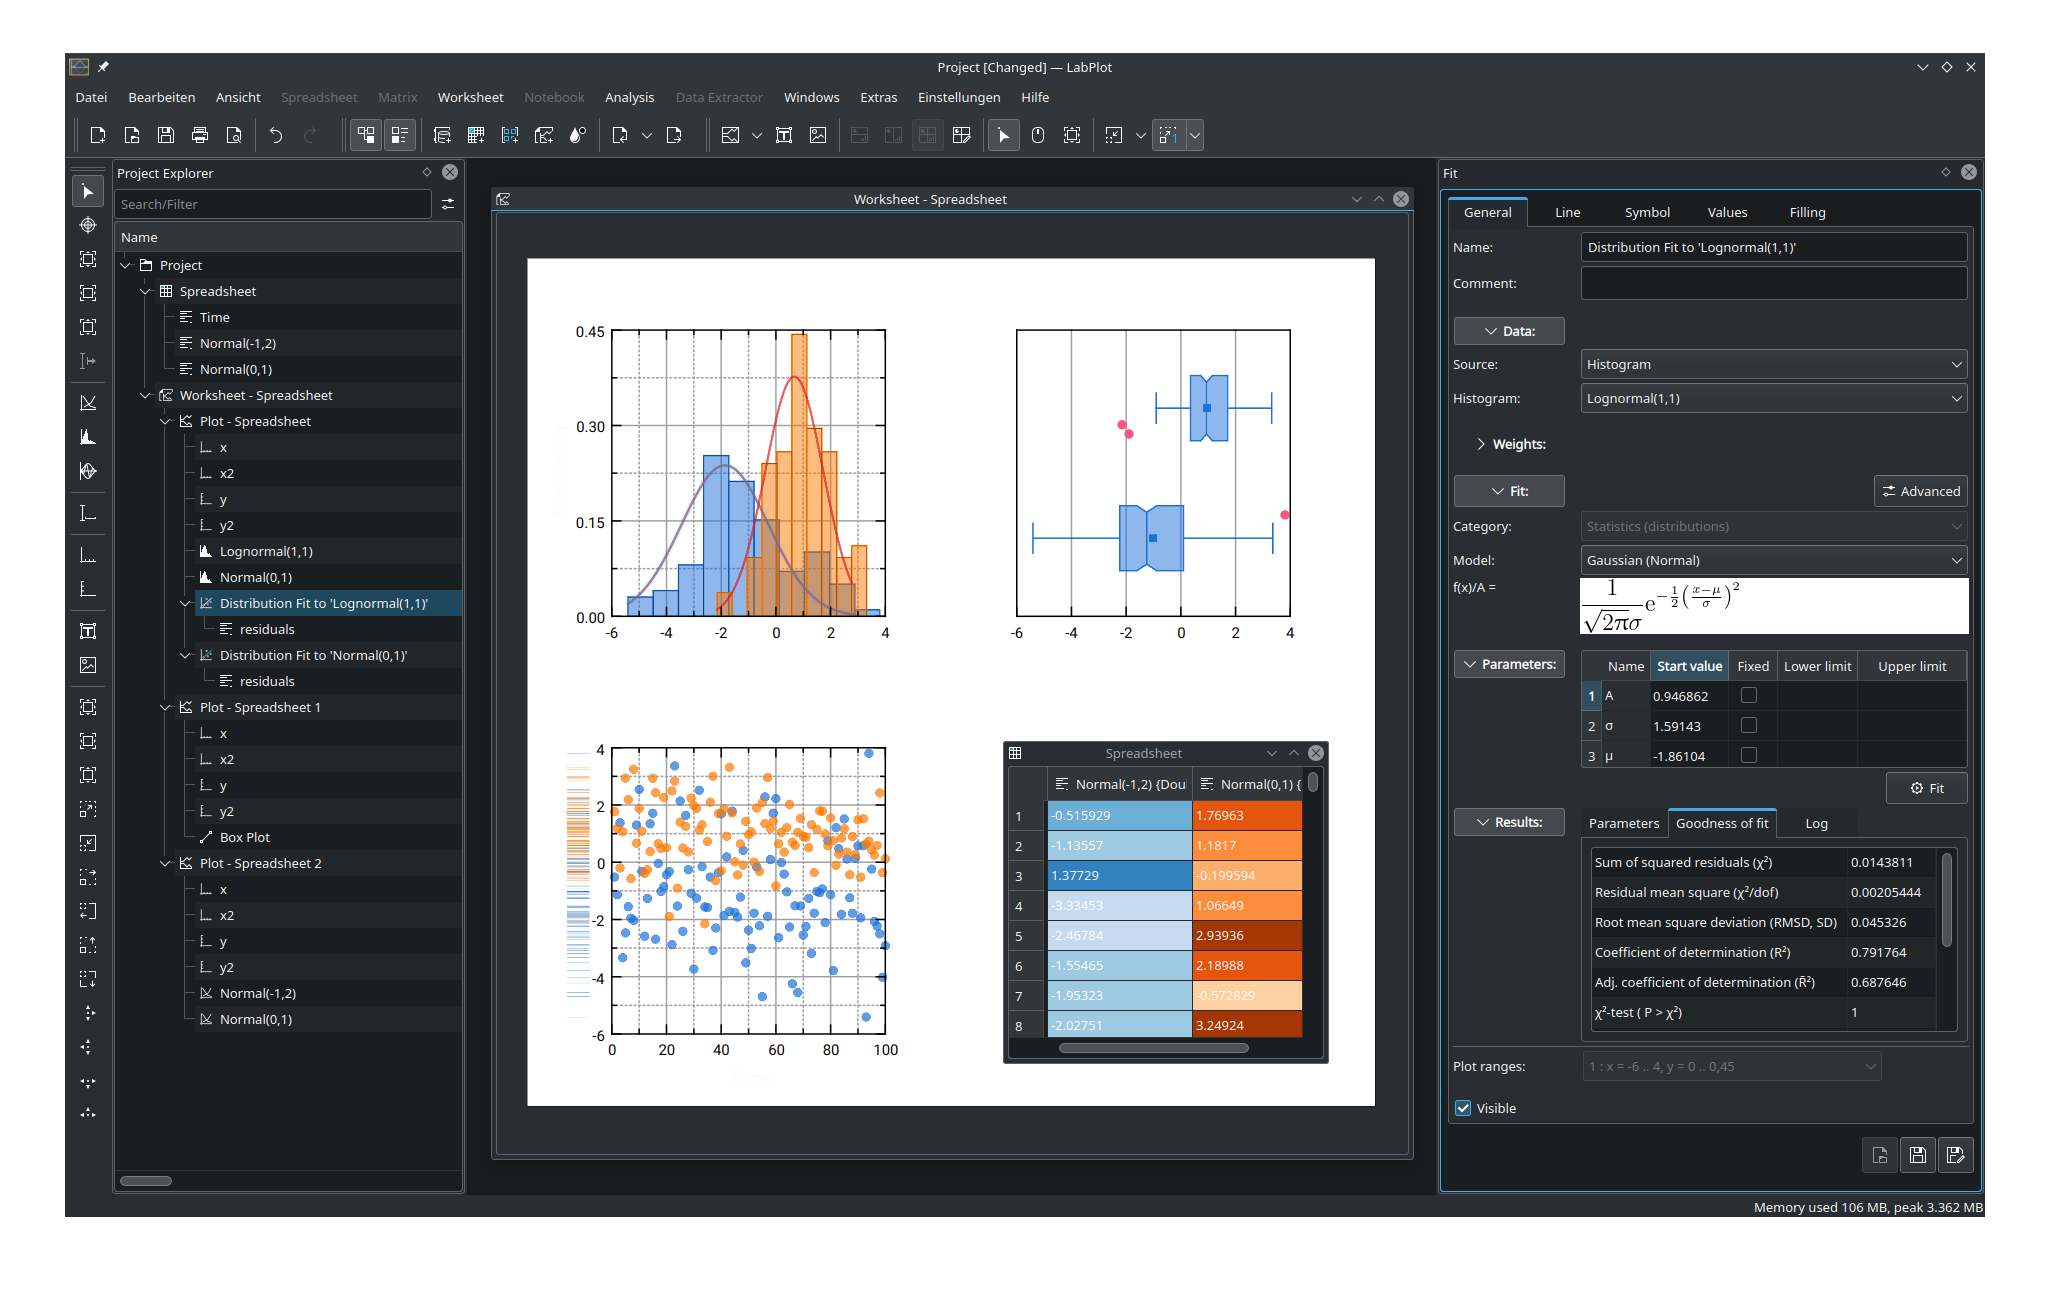
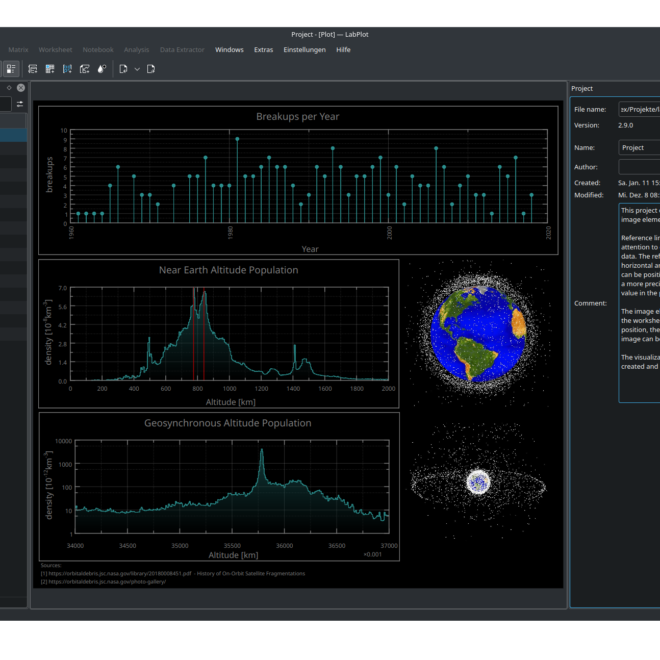
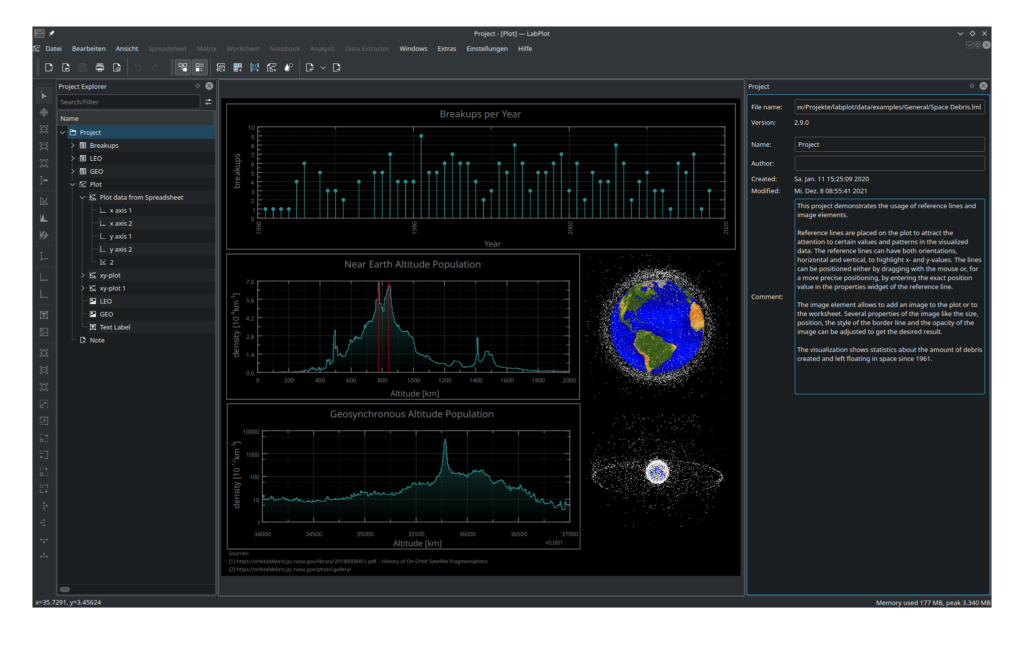
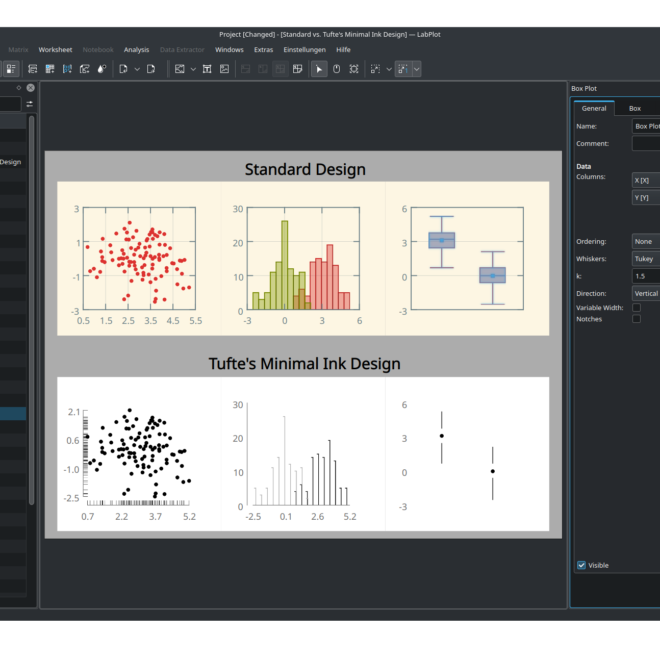
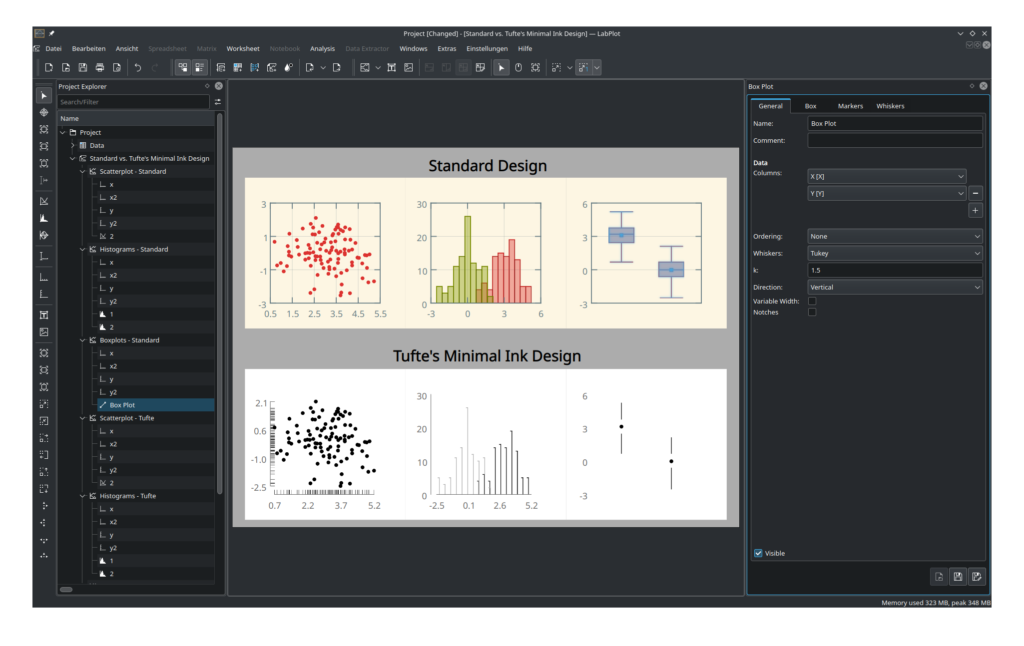
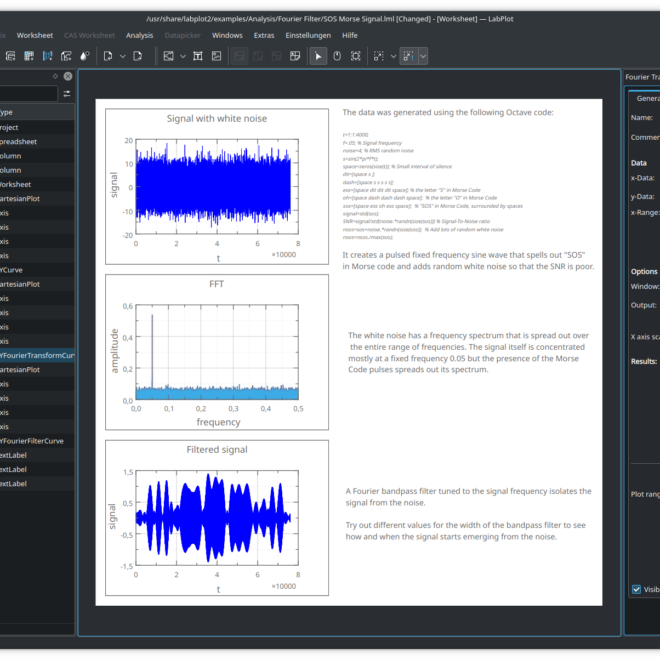
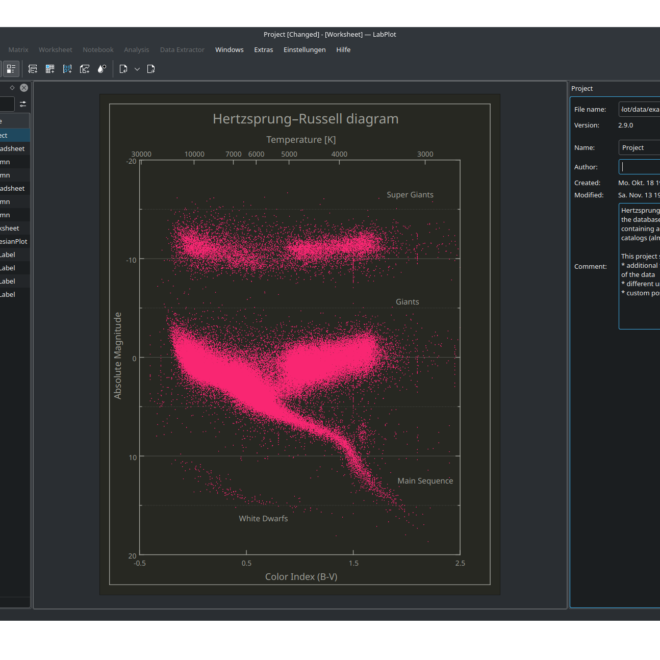
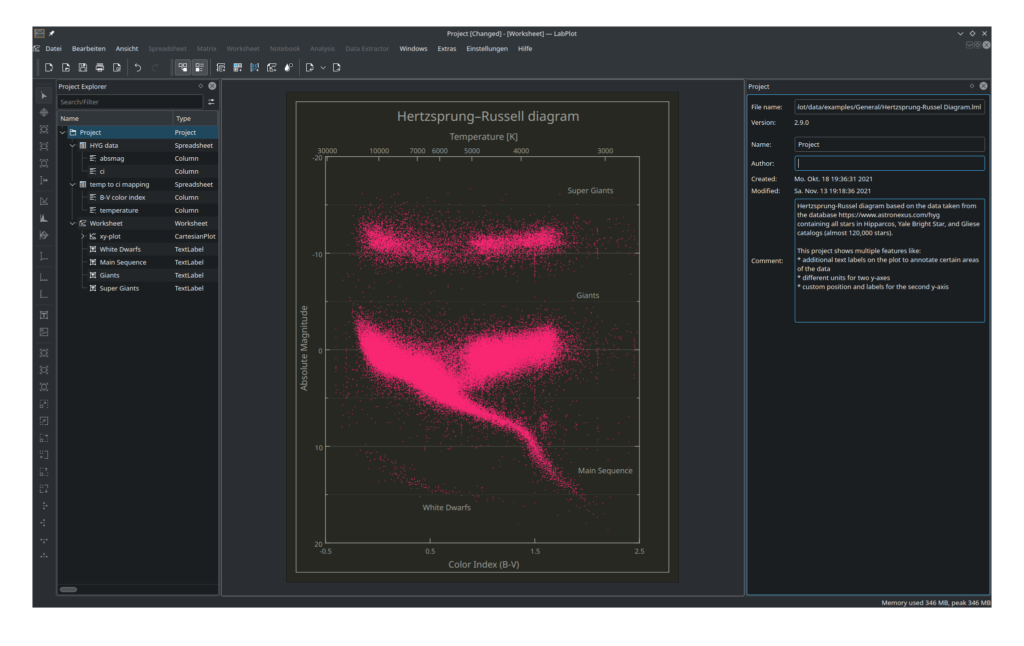
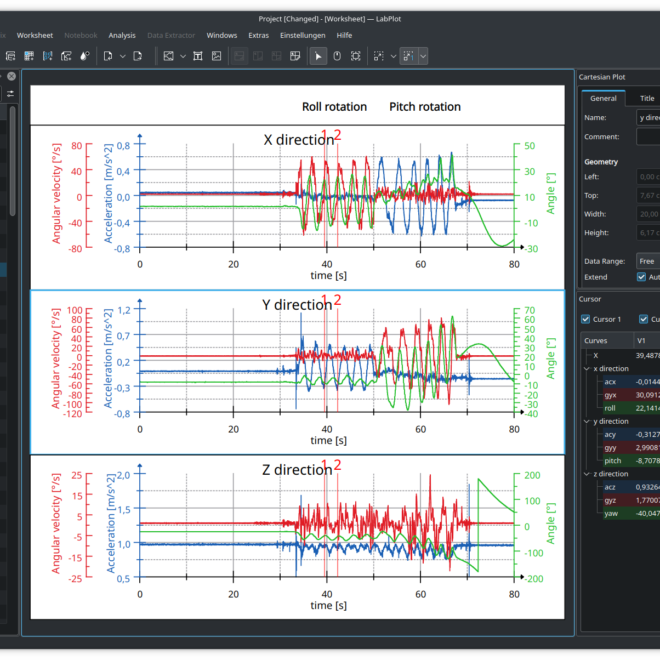
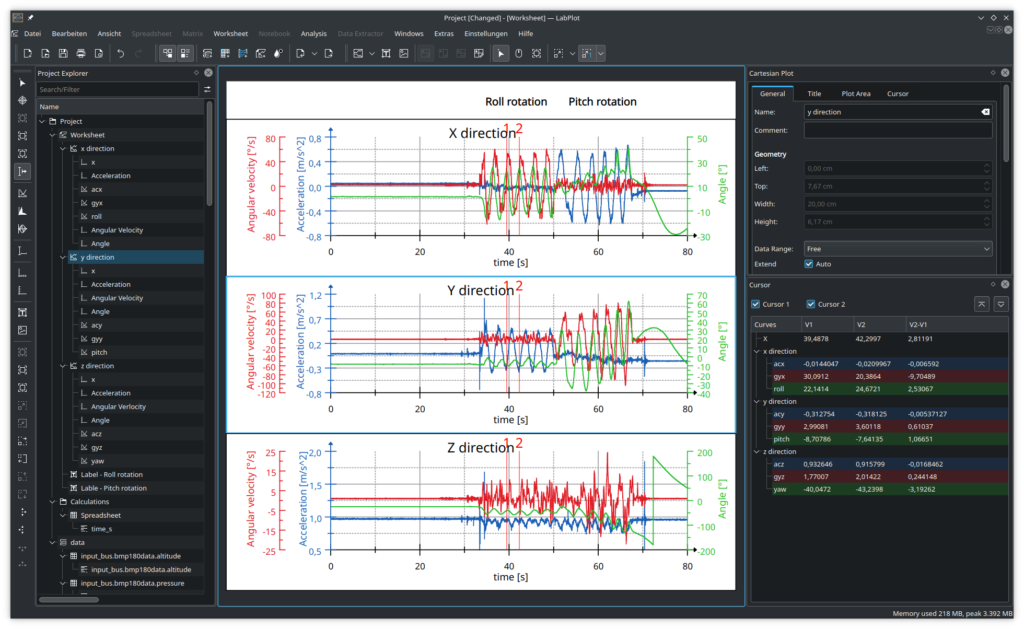
High-quality data visualization and interactive plotting with few clicks
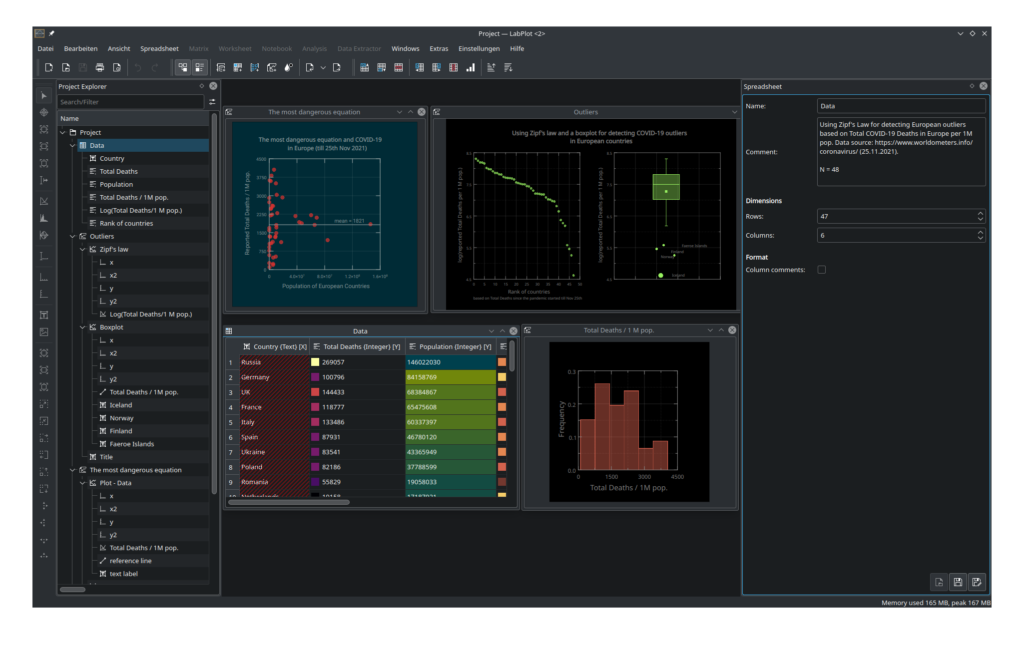
Reliable and easy data analysis, statistics, regression, curve and peak fitting
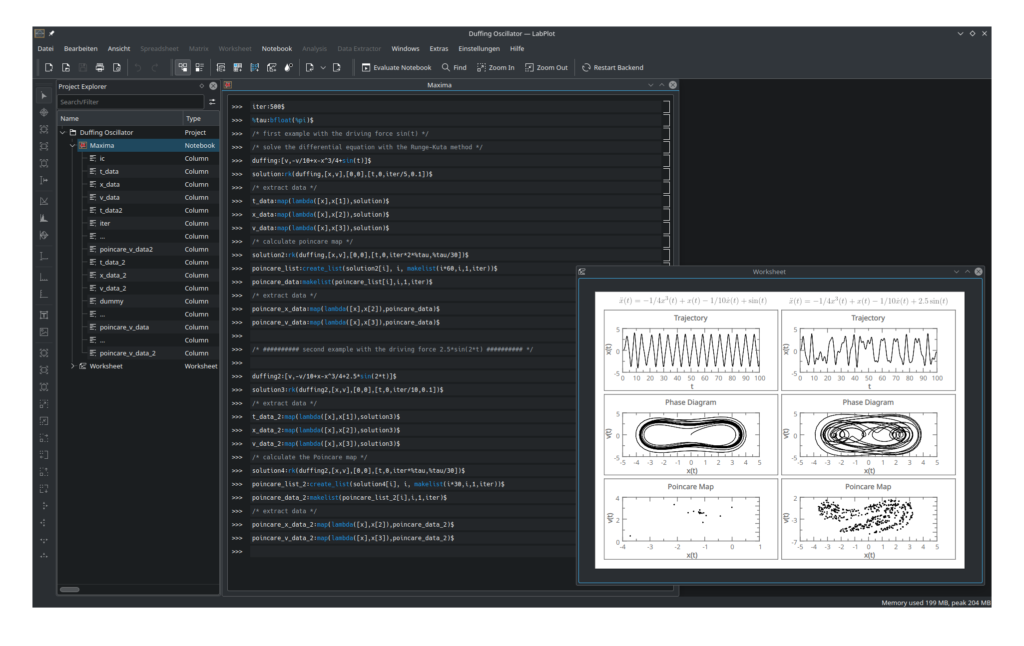
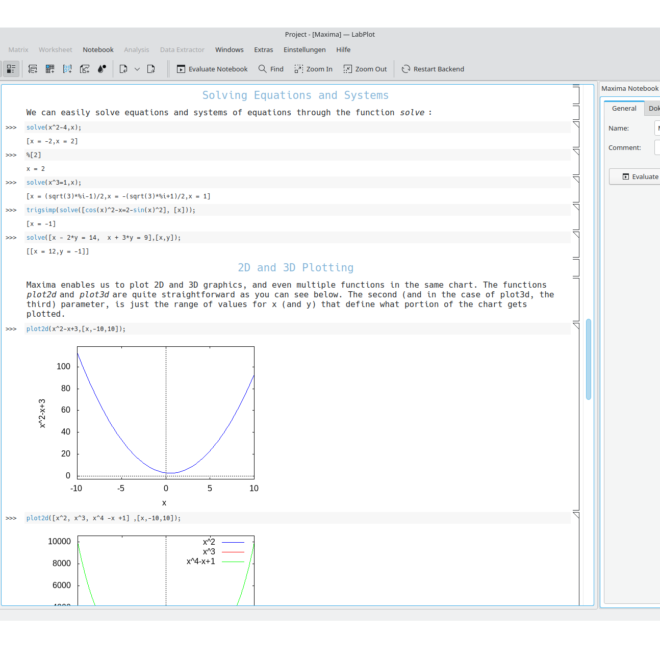
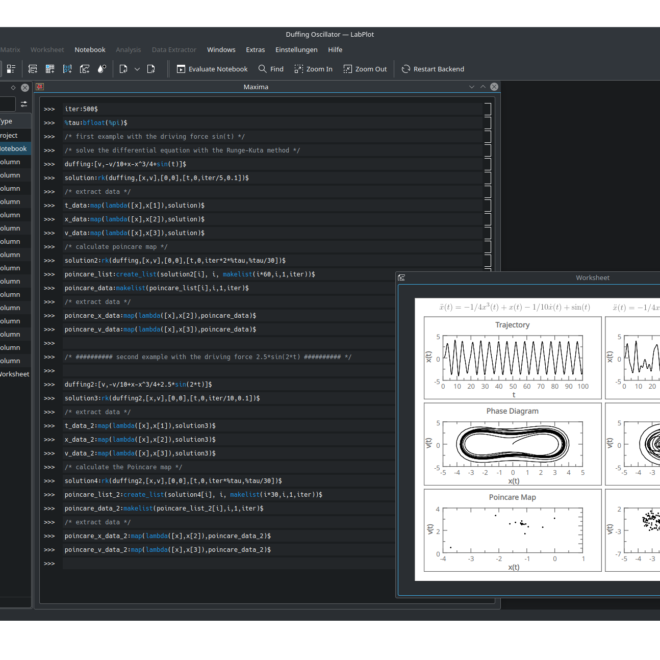
Intuitive and fast computing with interactive notebooks using Python, R, Julia etc.
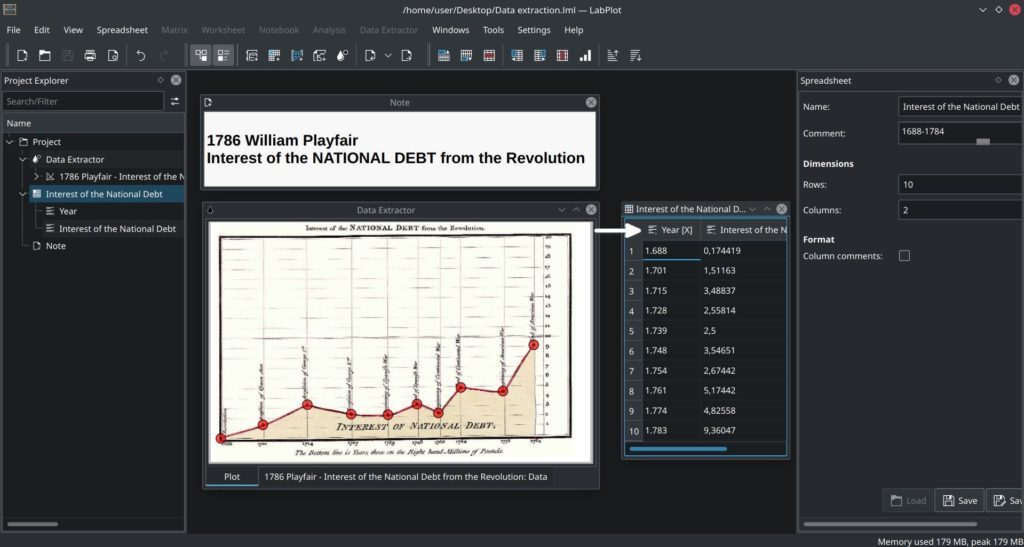
Effortless data extraction (plot digitizer) and support for real-time data
Smooth data import and export to and from multiple formats
Available for Windows, macOS, Linux, FreeBSD and Haiku
Visit feature page to view the complete feature list
LATEST NEWS
Stay in touch with recent developments
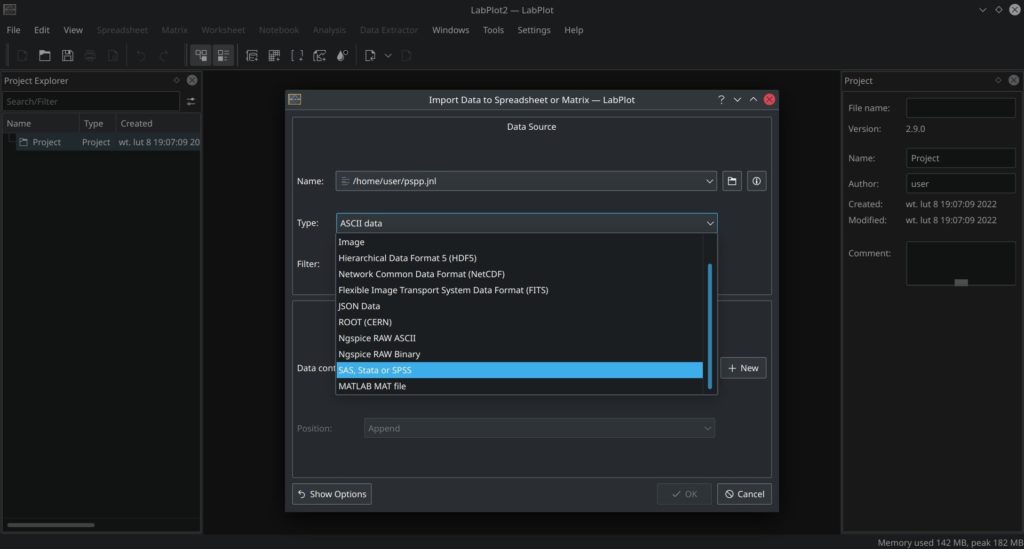
Performance of data import in LabPlot
In many cases, importing data into LabPlot for further analysis and visualization is the first step in the application: LabPlot supports many different formats (CSV, Origin, SAS, Stata, SPSS, MATLAB, SQL, JSON, binary, OpenDocument Spreadsheets (ods), Excel (xlsx), HDF5, MQTT, Binary Logging Format (BLF), FITS,…
Google Summer of Code 2024
Programmes like Season of KDE (SoK) and Google Summer of Code (GSoC) provide a great opportunity for young talent to become part of the open source community and contribute to open source projects. LabPlot, and KDE in general, has a long history and experience in…

Bad information drives out good or how much can we trust Wikipedia?
This post is written on behalf of the LabPlot team. It’s different compared to what we usually publish on our homepage but we feel we need to share this story with our community. Introduction You might already know this, but finalizing a release for a…
LabPlot funded through NGIO Core Fund
This year we applied to NLnet’s NGI Zero Core open call for proposals in February 2024. After a thorough review by the NLnet Foundation, LabPlot’s application was accepted and will be funded by the NGI0 Core Fund, a fund established by NLnet with financial support…
LabPlot 2.11 released
Say hello to LabPlot 2.11! This brand new release comes with many new features, improvements and performance enhancements in several areas, as well as support for more data formats and visualisation types. The main new features are outlined below. For a more detailed overview of…

LabPlot 2.10.1 released
Today we are announcing the availability of the minor patch release 2.10.1. This release contains minor improvements and bug fixes only. The fixes are distributed over many different areas of the application and we recommend everybody update to this patch release which is available from…
LabPlot 2.10
Today we are announcing the availability of the latest release of LabPlot: Say hello to LabPlot 2.10! This release comes with many new features, improvements and performance optimizations in different areas, as well as with support for new data formats and visualization types. The major…
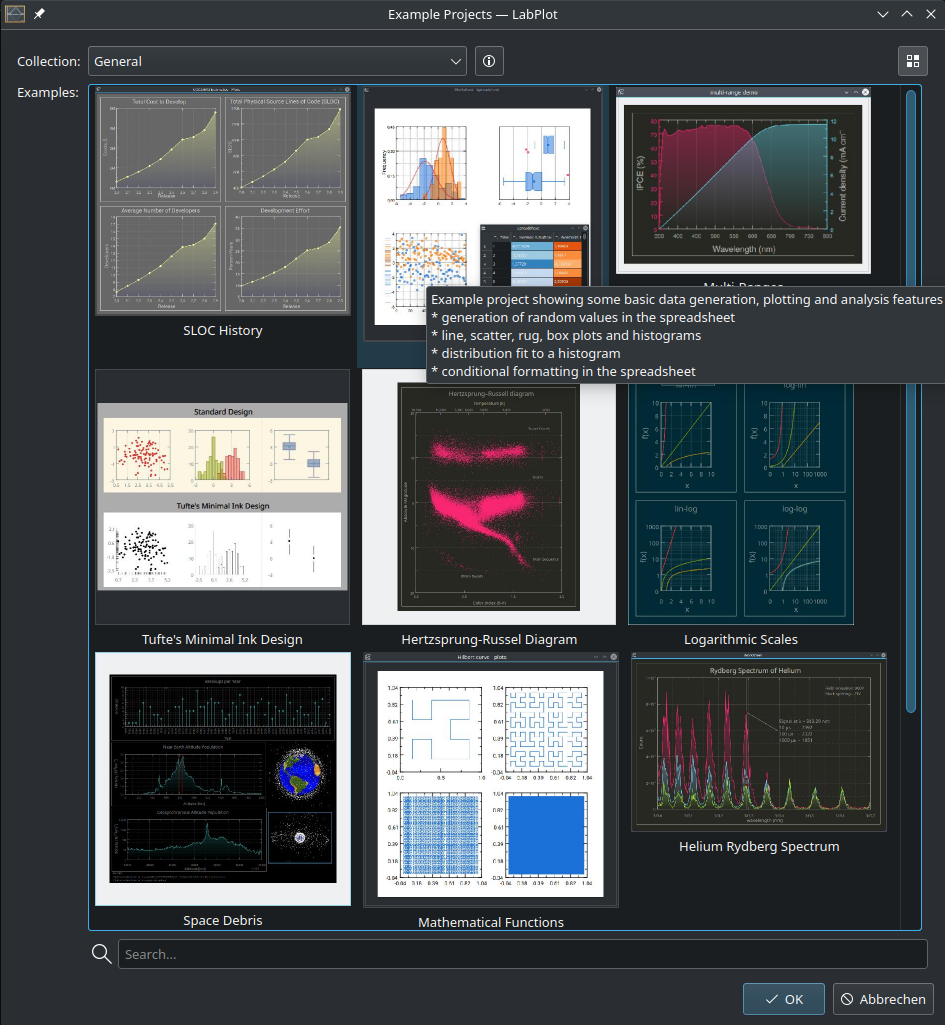
Example Projects
In the face of a growing feature set in any project, getting started becomes harder and harder for new users. This problem is common for many software applications, and LabPlot is no exception. To overcome this problem we’re investing more resources into creating documentation in…
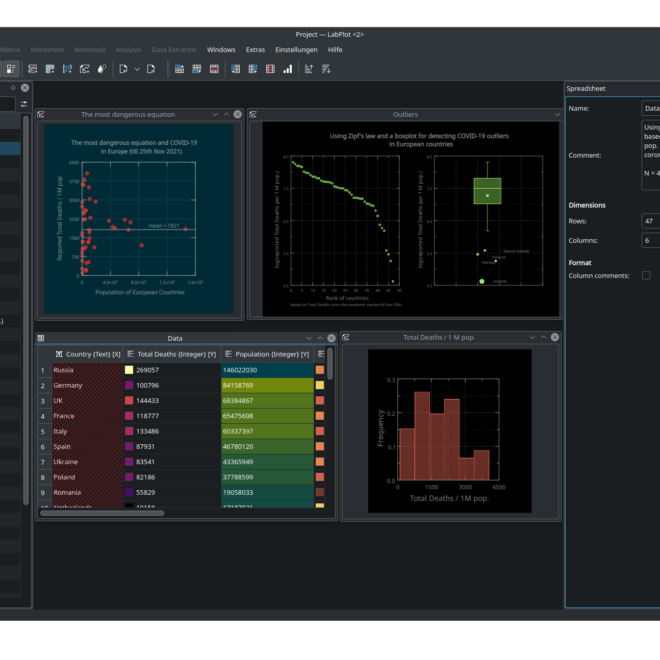
LabPlot 2.9 released
LabPlot 2.9 released After a long development and additional testing and beta phases, we’re happy to announce the availability of the next release of LabPlot. In this release we’re bringing again a significant amount of new features and improvements in different areas of LabPlot. The…
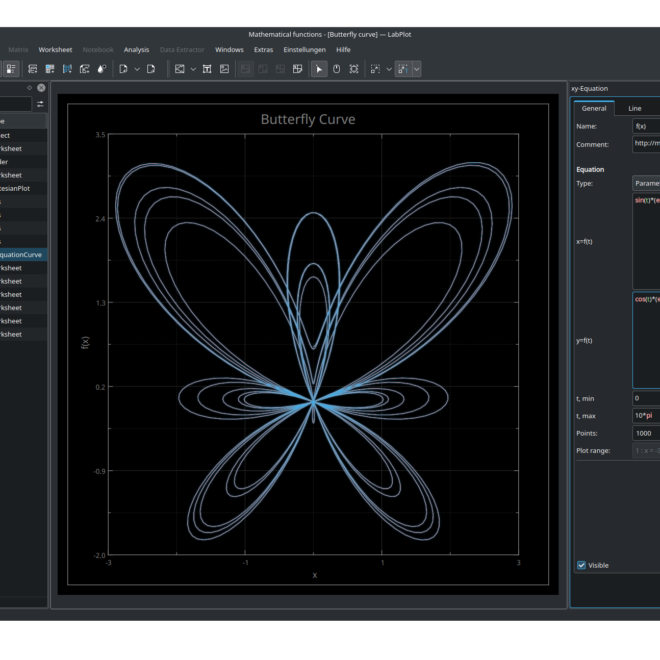
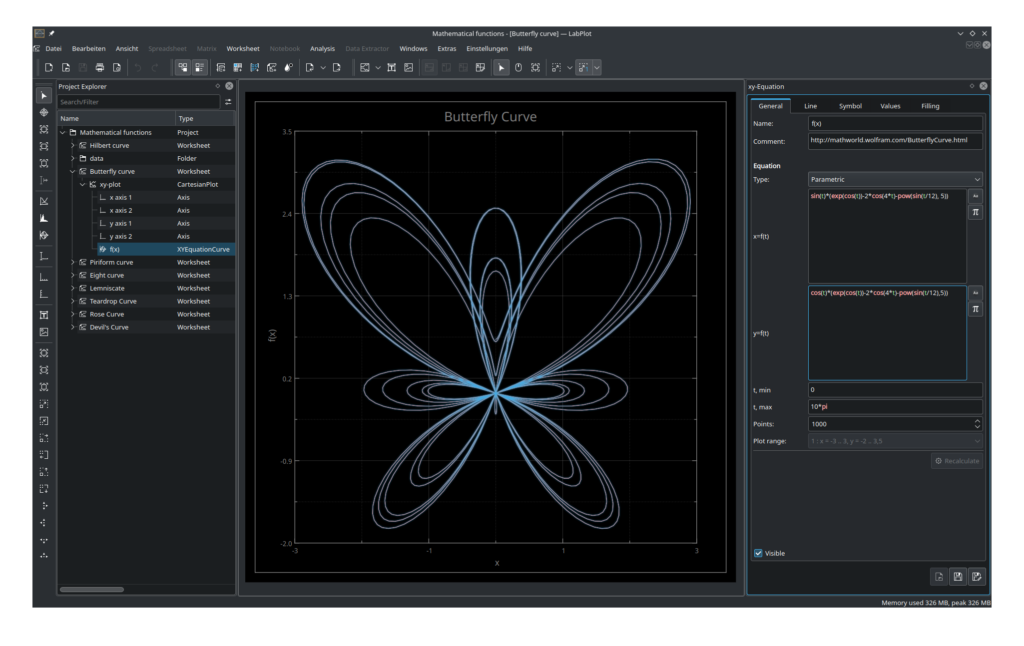
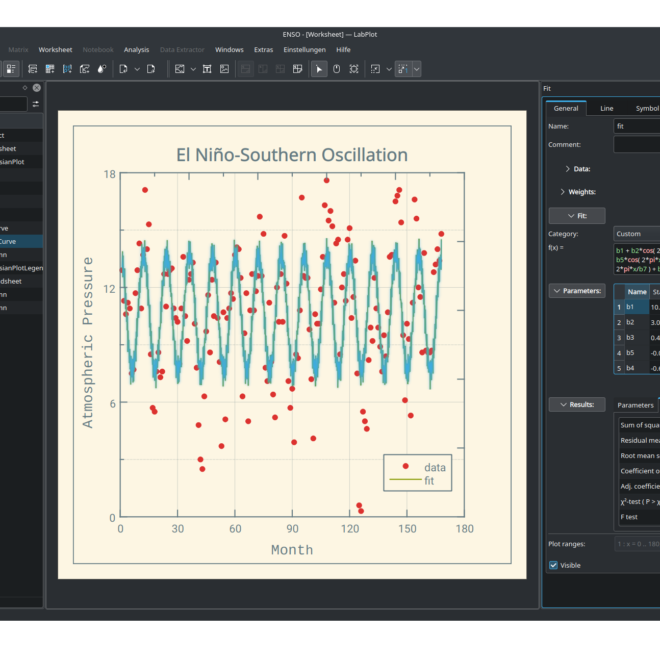
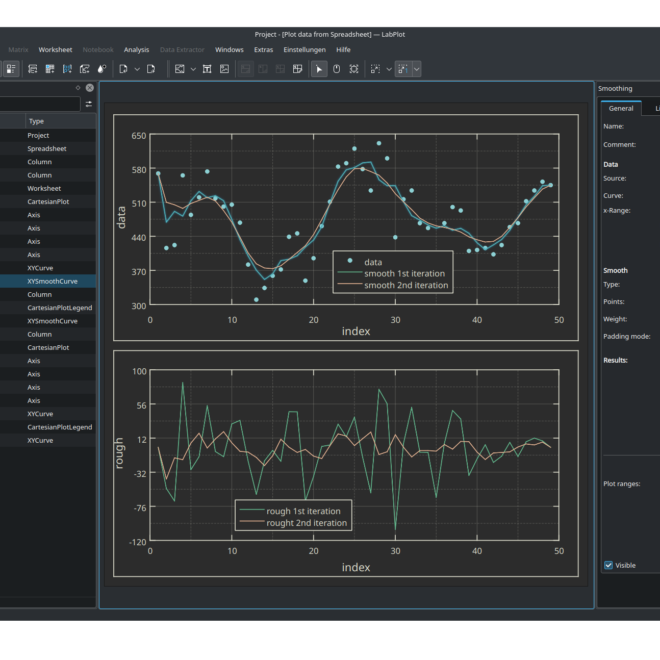
GALLERY
Get a first impression