Windows version of LabPlot is coming (soon)
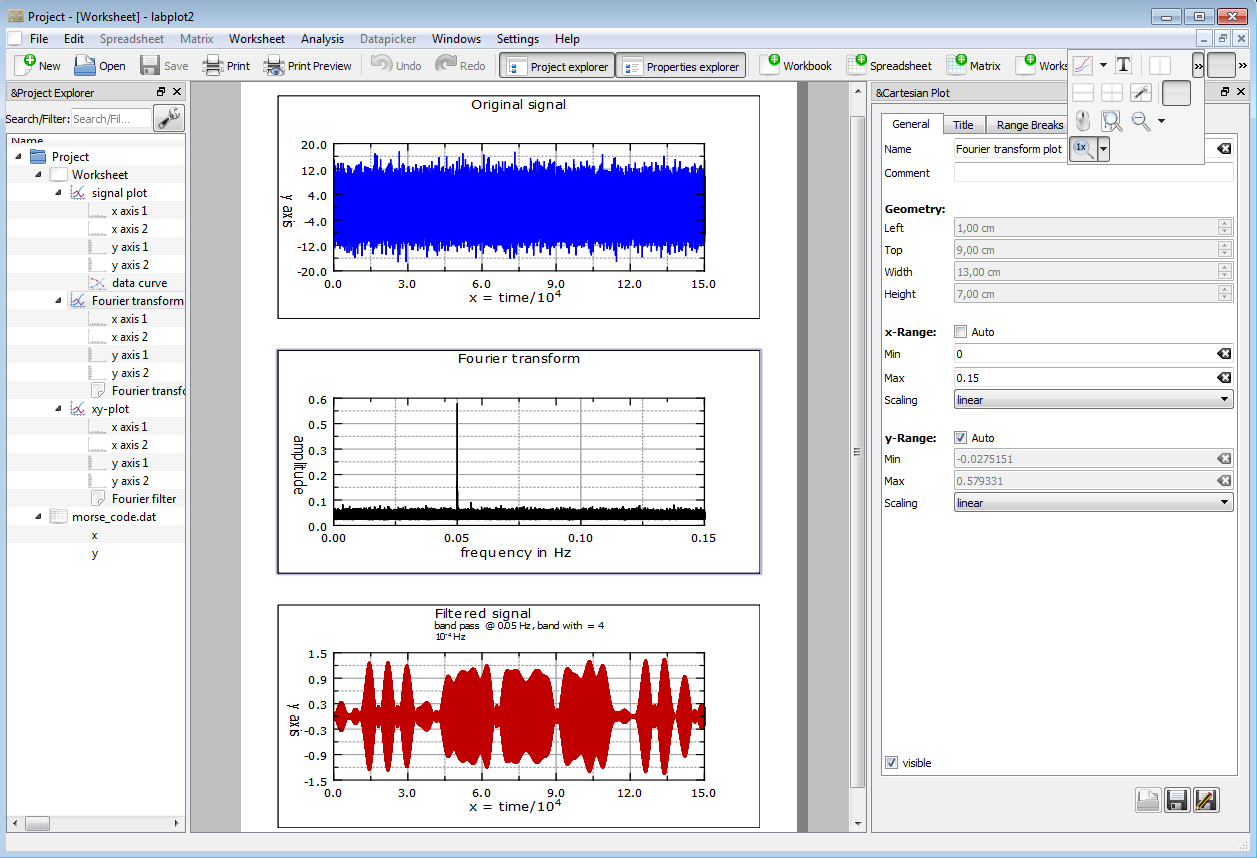
We are coming close to the next release of LabPlot with a lot of new features. The development for the next release is finished and we’re doing some final testing, improving the documentation, checking the issues reported by code analysis tools, etc. As always, we’ll write about this a dedicated and detailed release announcement soon. Today, as a small teaser for what will come soon we just want to share some information about what many people were already asking for – Windows port of LabPlot:

On the screenshot (taken on Windows7) you see also some new features like “Fourier transformation” and “Fourier Filter” – more on this later. Starting with the next release, v2.3.0, we’ll provide installers for Windows (32bit and 64bit) and we hope to provide a Mac port of LabPlot in the near future, too.
While porting LabPlot to Windows we benefited a lot from the community and the experience of other KDE projects. Bringing KDE Software to other platforms like Windows, OSX and Android was the main topic during this year meeting of KDE developers in Randa, Switzerland. If you like KDE, if you like LabPlot and if you wish to see more KDE applications running on different platforms, please consider supporting our Randa Meetings 2016 Fundraiser Campaign!

I installed a version of Labplot for Windows 64bit, but the program does’nt start because a dll file is missing (MSVCR120.dll). What can I do ?
Please try the latest package from
https://theorie.physik.uni-konstanz.de/gerlach/labplot/labplot-2.5.0rc10-64bit-setup.exe
In the meantime we fixed a lot of bugs in the Windows packages.
Thanks a lot for your work!
I have installed the version you suggest, and many things work fine, but I cannot change the limits of the axis in a plot (nothing happens when I untick auto and introduce a different number.
Sorry for the late replay. Most probably you want to change the data range of the plot. For this select the plot in the project explorer and modify the ranges. If you keep the axis to “auto fit”, the axis will adjust its ranges to the data ranges of the plot. If you uncheck “auto fit” and provide new ranges, the axis will be drawn for this specific range only.