Histogram
LabPlot has already quite a good feature set that allows to create 2D Cartesian plots with a lot of editing possibilities and with a good variety of different data sources supported. Analysis functionality is also getting more and more extended and matured with every release. Based on the overall good foundation it’s time now to take care also of other plot types and visualization techniques. As part of the next release 2.6 we’re going to ship the histogram.
This feature was originally developed by Anu Mittal who contributed to LabPlot during Google Summer of Code 2016. We finally managed to finalize this code, to extend and to prepare it for the release:
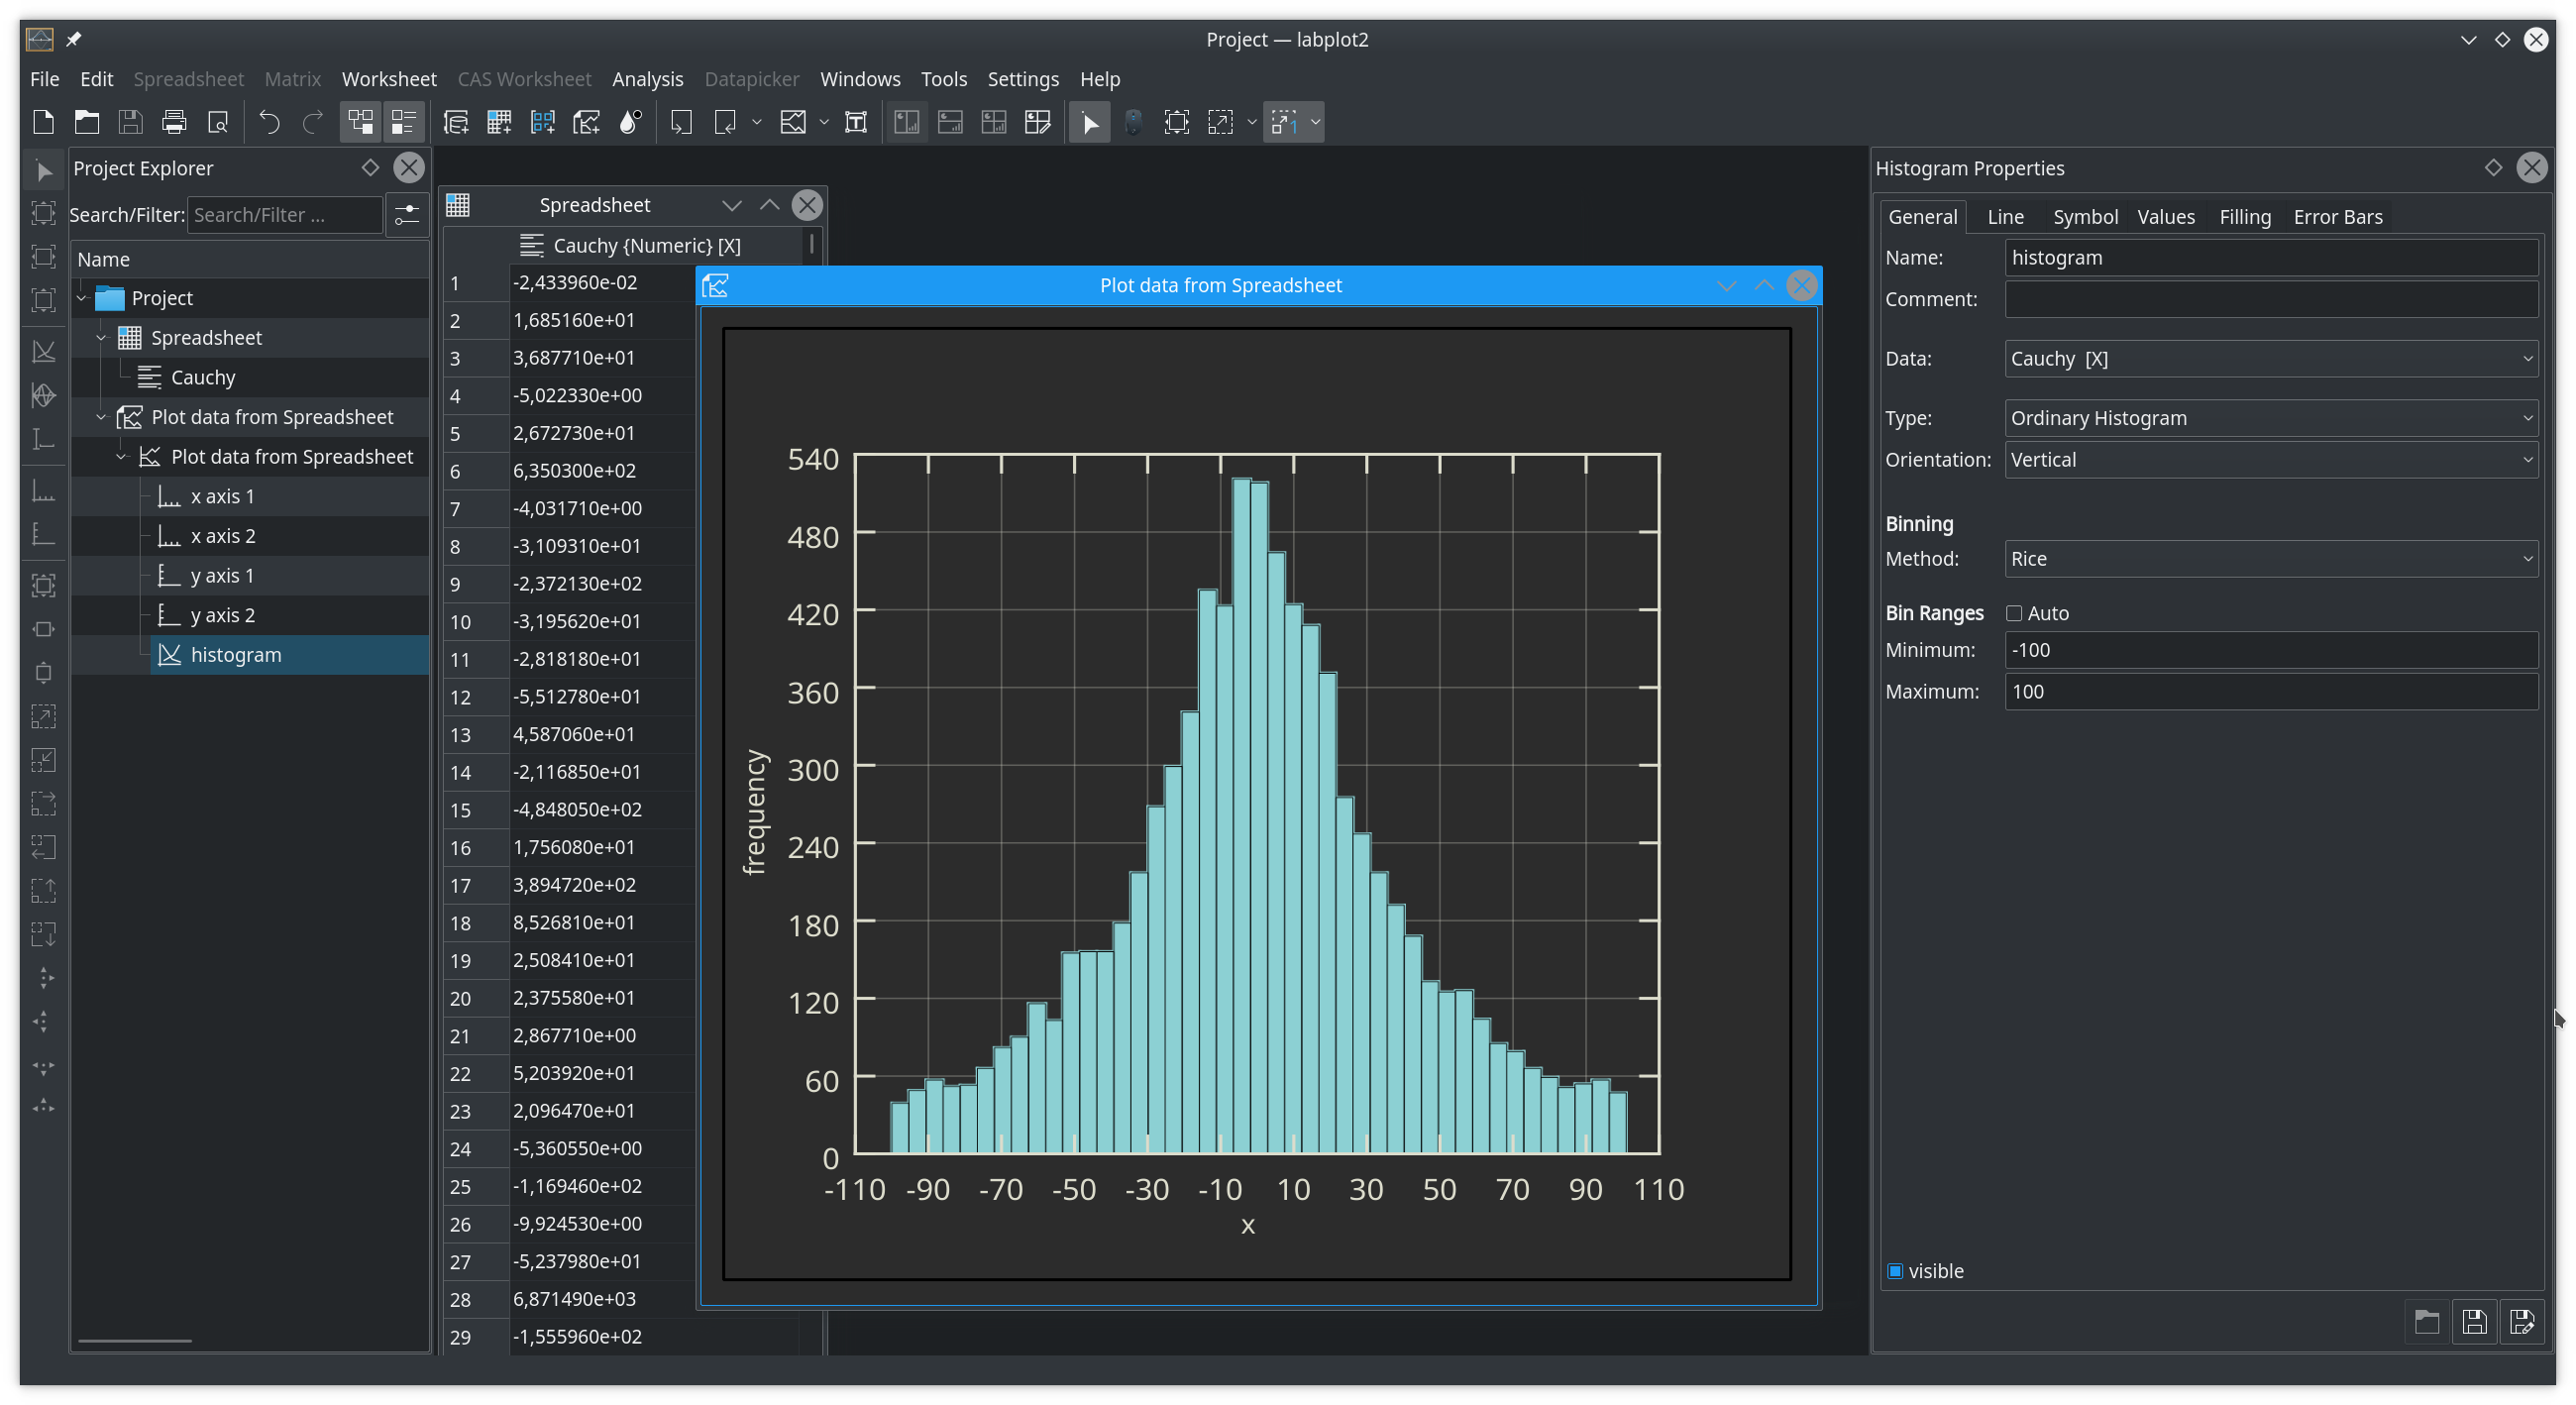
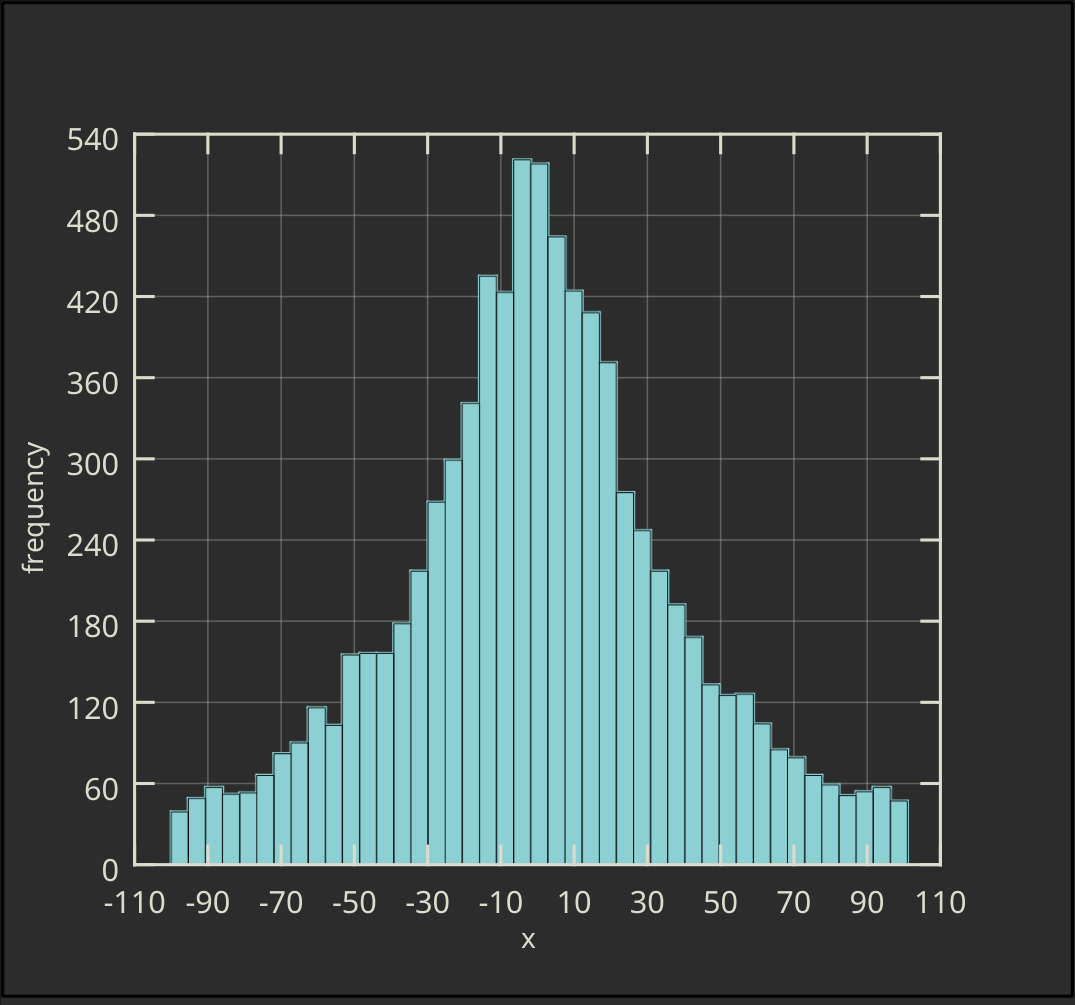
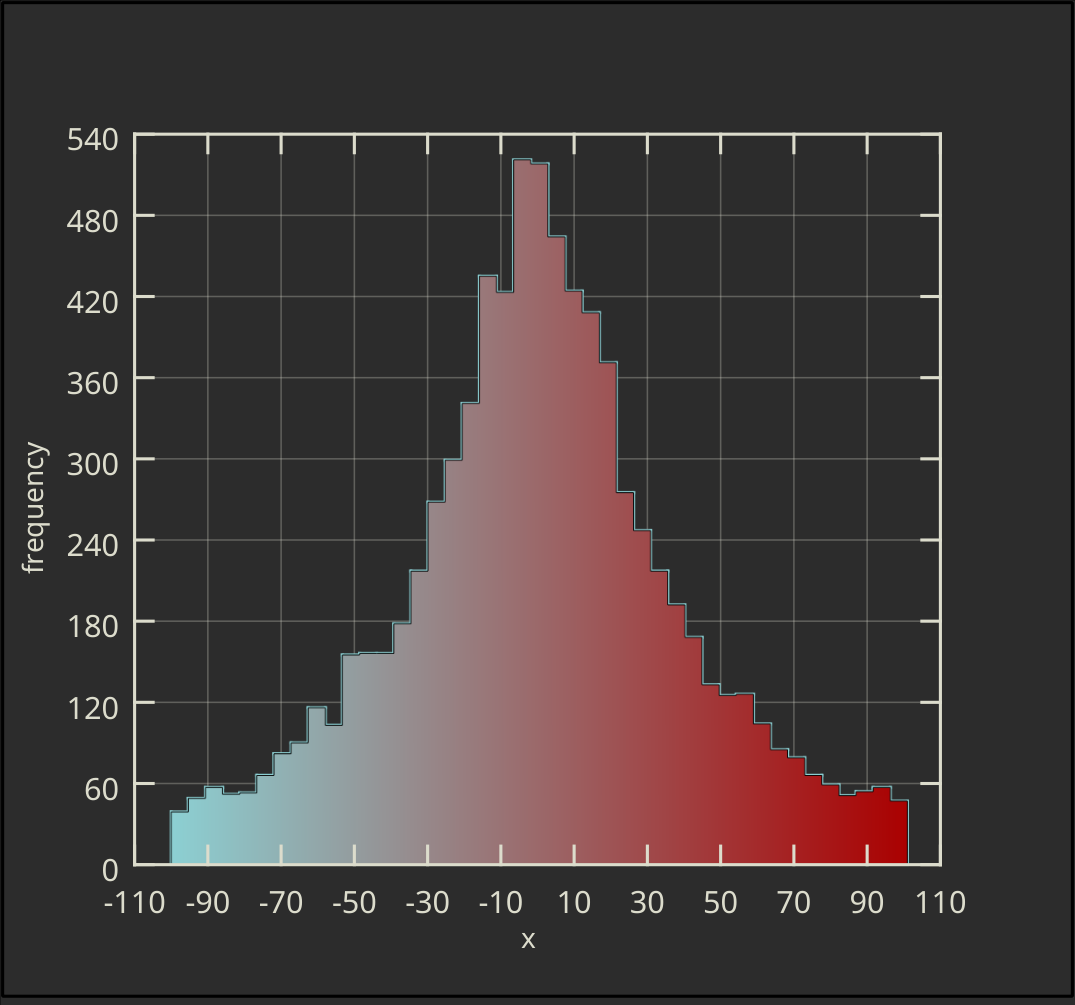
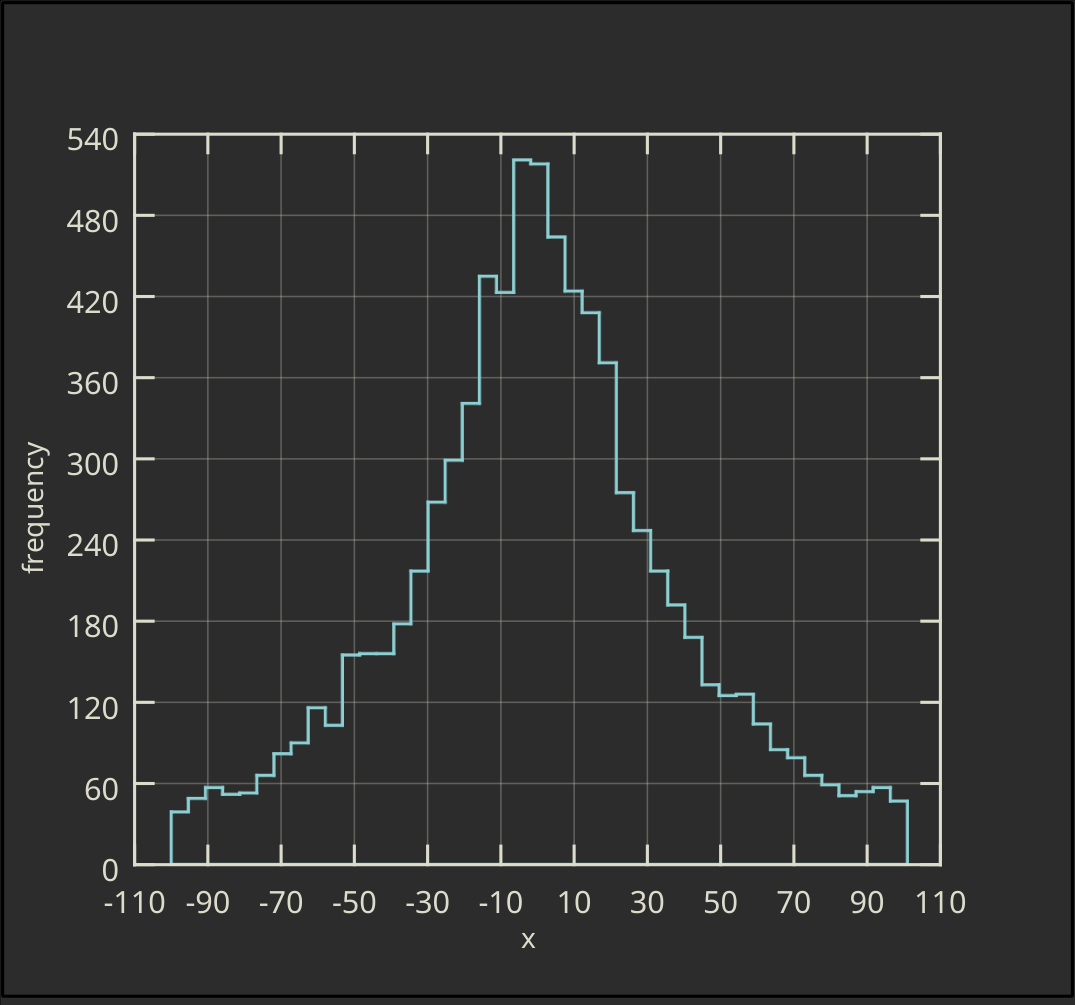
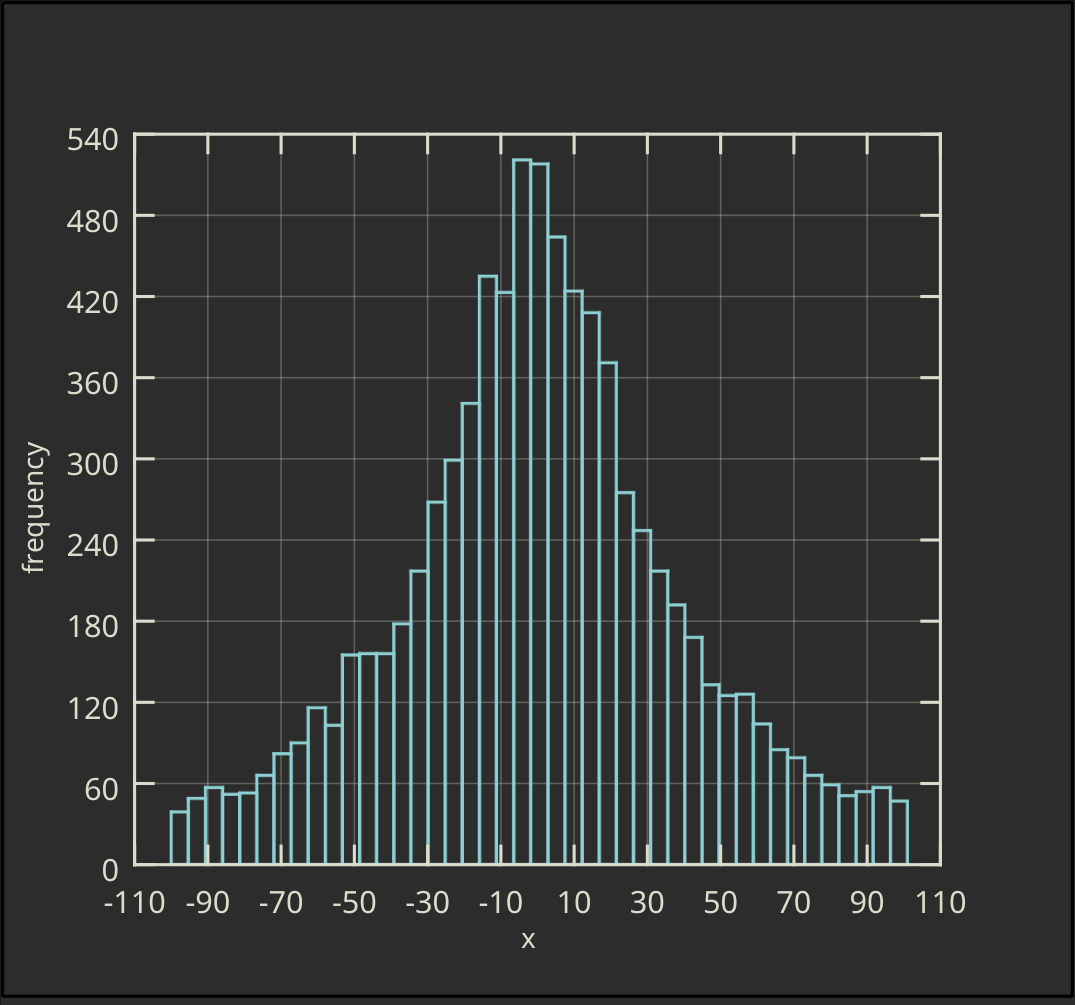
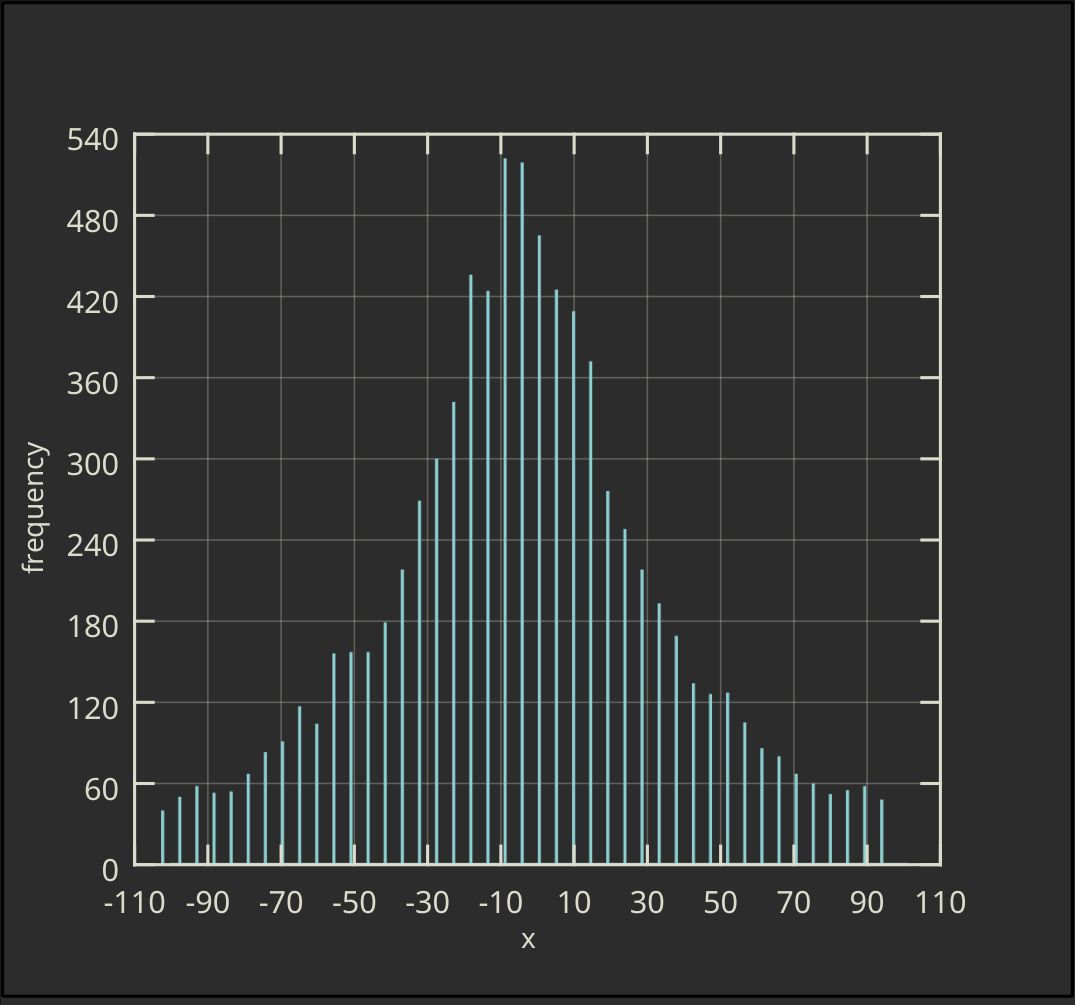
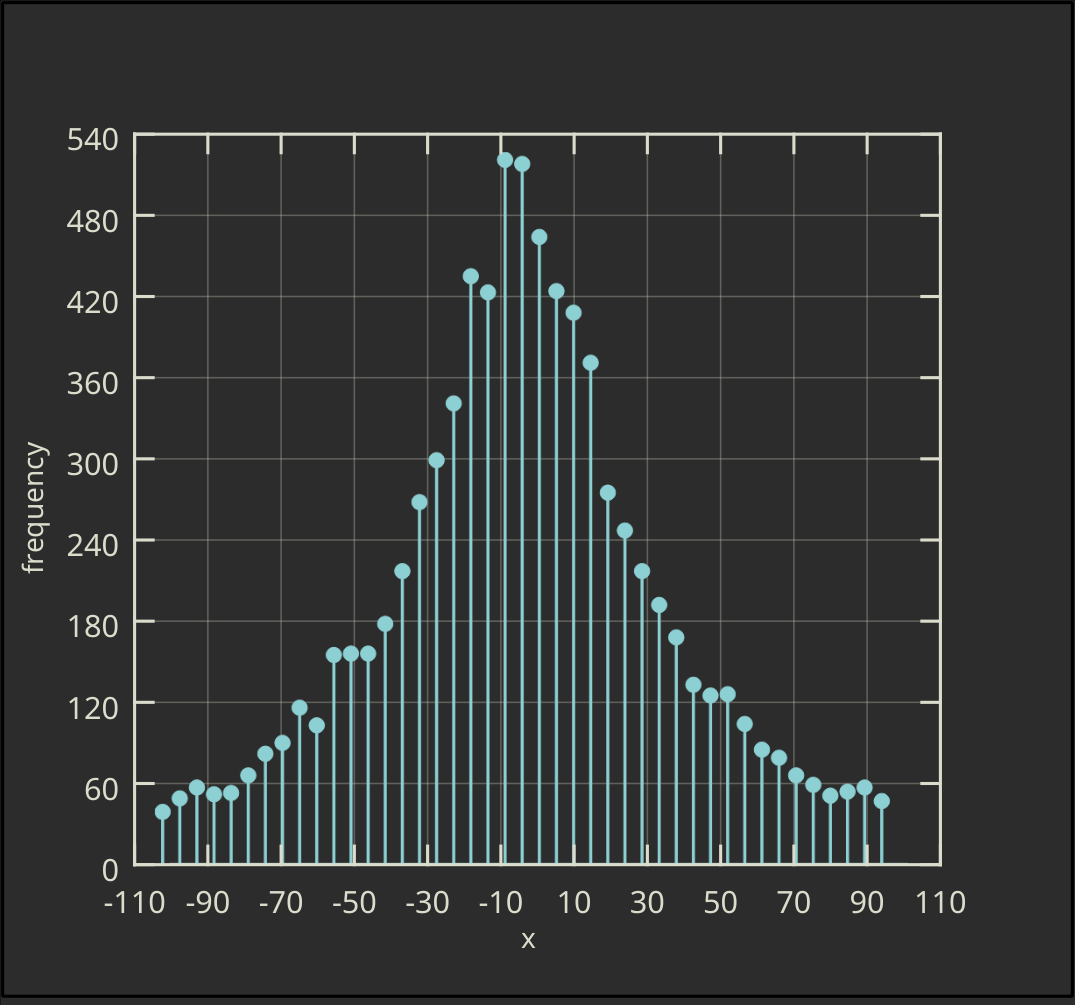
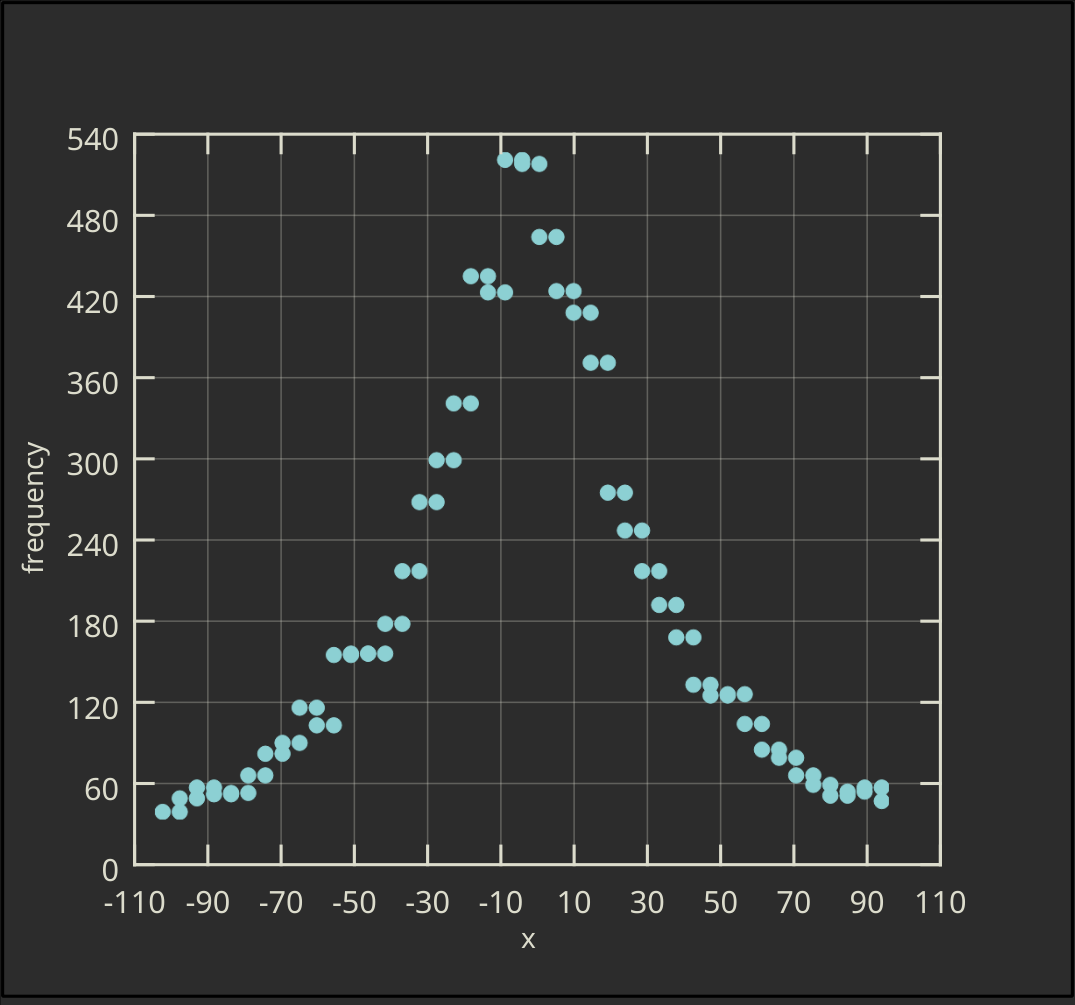
Also for this type of the data visualization, modifications of the appearance are couple of mouse clicks away. The plots below show couple of histograms for the same data set:

Cumulative histograms are supported, too. The next plots compare the ordinary and the cumulative histograms for the same data:


Similar for the two possible orientations of the histogram – vertical and horizontal:

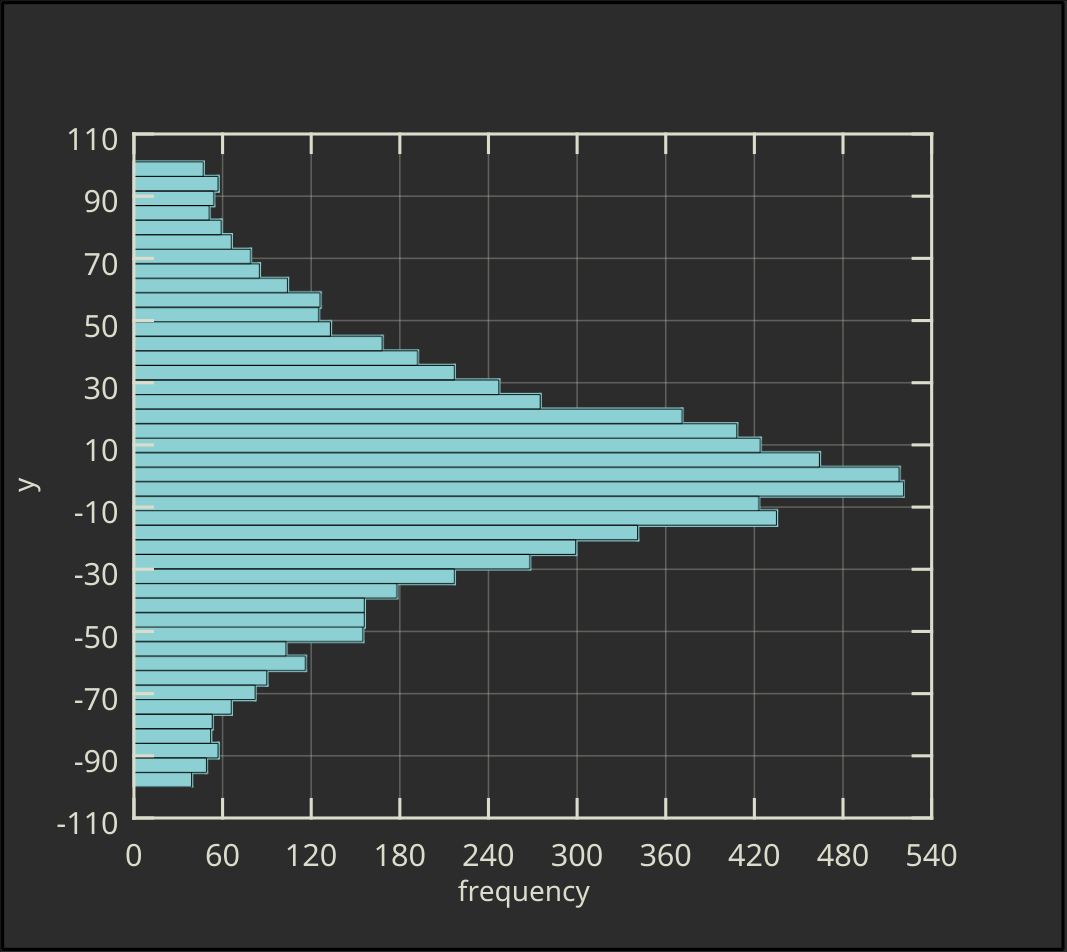
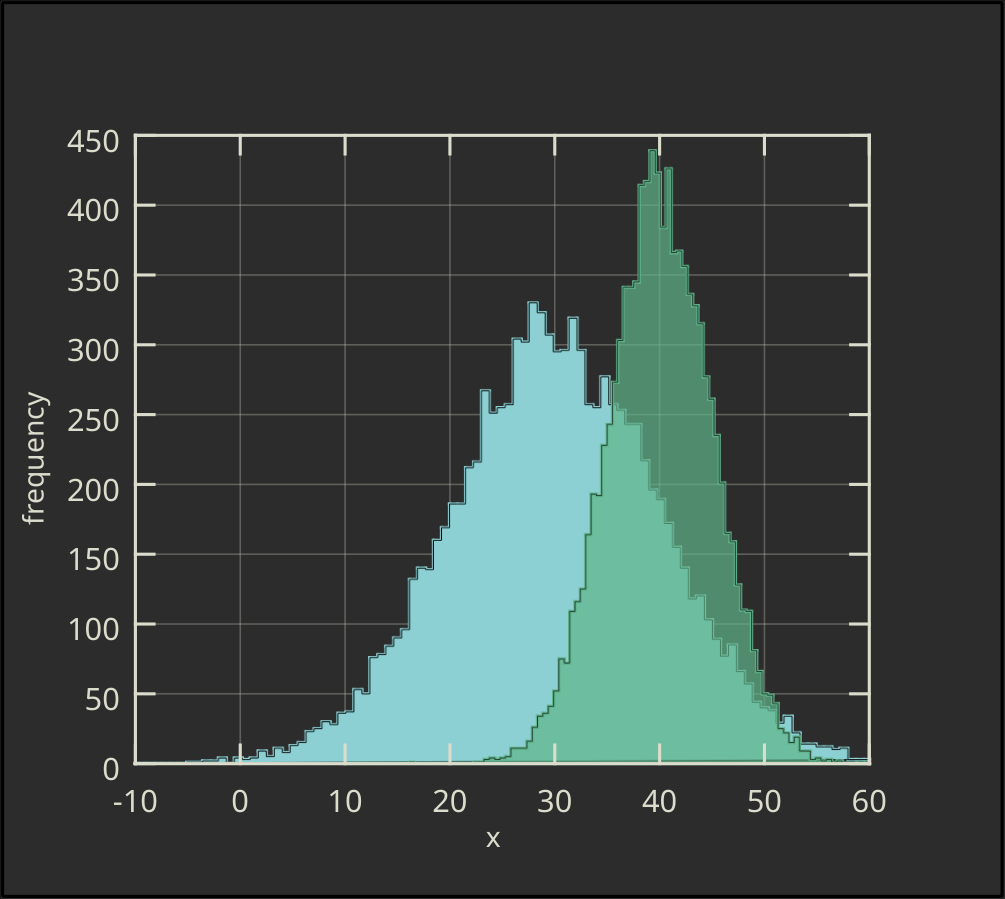
Plotting of two and more histograms in the same plot is also possible where some nice looking results can be achieved by varying the opacity of the histogram fillings:
Selection of the number of bins for the histogram is an art of its own. LabPlot implements couple of common techniques to set the number of bins such as the square-root rule, Rice and Sturges rules, etc. Furthermore, the number of bins or their widths can also be specified explicitly by the user.
With this, LabPlot 2.6 will cover many different visualization techniques for histograms. More advanced features like logarithmic binning, average shifted histograms, histograms with error bars etc. will be implemented in the next releases.

It’s cool. I’ll look forward to logarithmic binning, average shifted histograms and etc
Is it possible to make a simple bar graph? (where: y = value, x = text) Drawing this as a histogram looks like a very complicated way, and I haven’t found another way in LabPlot.
This is not possible. In the next release we plan to bring more features for the categorical data and your example will be easy to get.
Still waiting. Version 2.10.0