MATLAB, SAS, Stata and SPSS files in LabPlot
The analysis and the visualization of data normally starts with the data itself. Though it is possible to create the data directly in LabPlot, in many cases it will be coming from an external sources. For an application like LabPlot, it is essential to support the relevant data sources of popular and frequently used file formats. To the many already supported file formats (see features for an overview), in the coming release we’re adding the support for MATLAB’s .mat files and for multiple file formats produced by statistical applications SAS, Stata and SPSS.
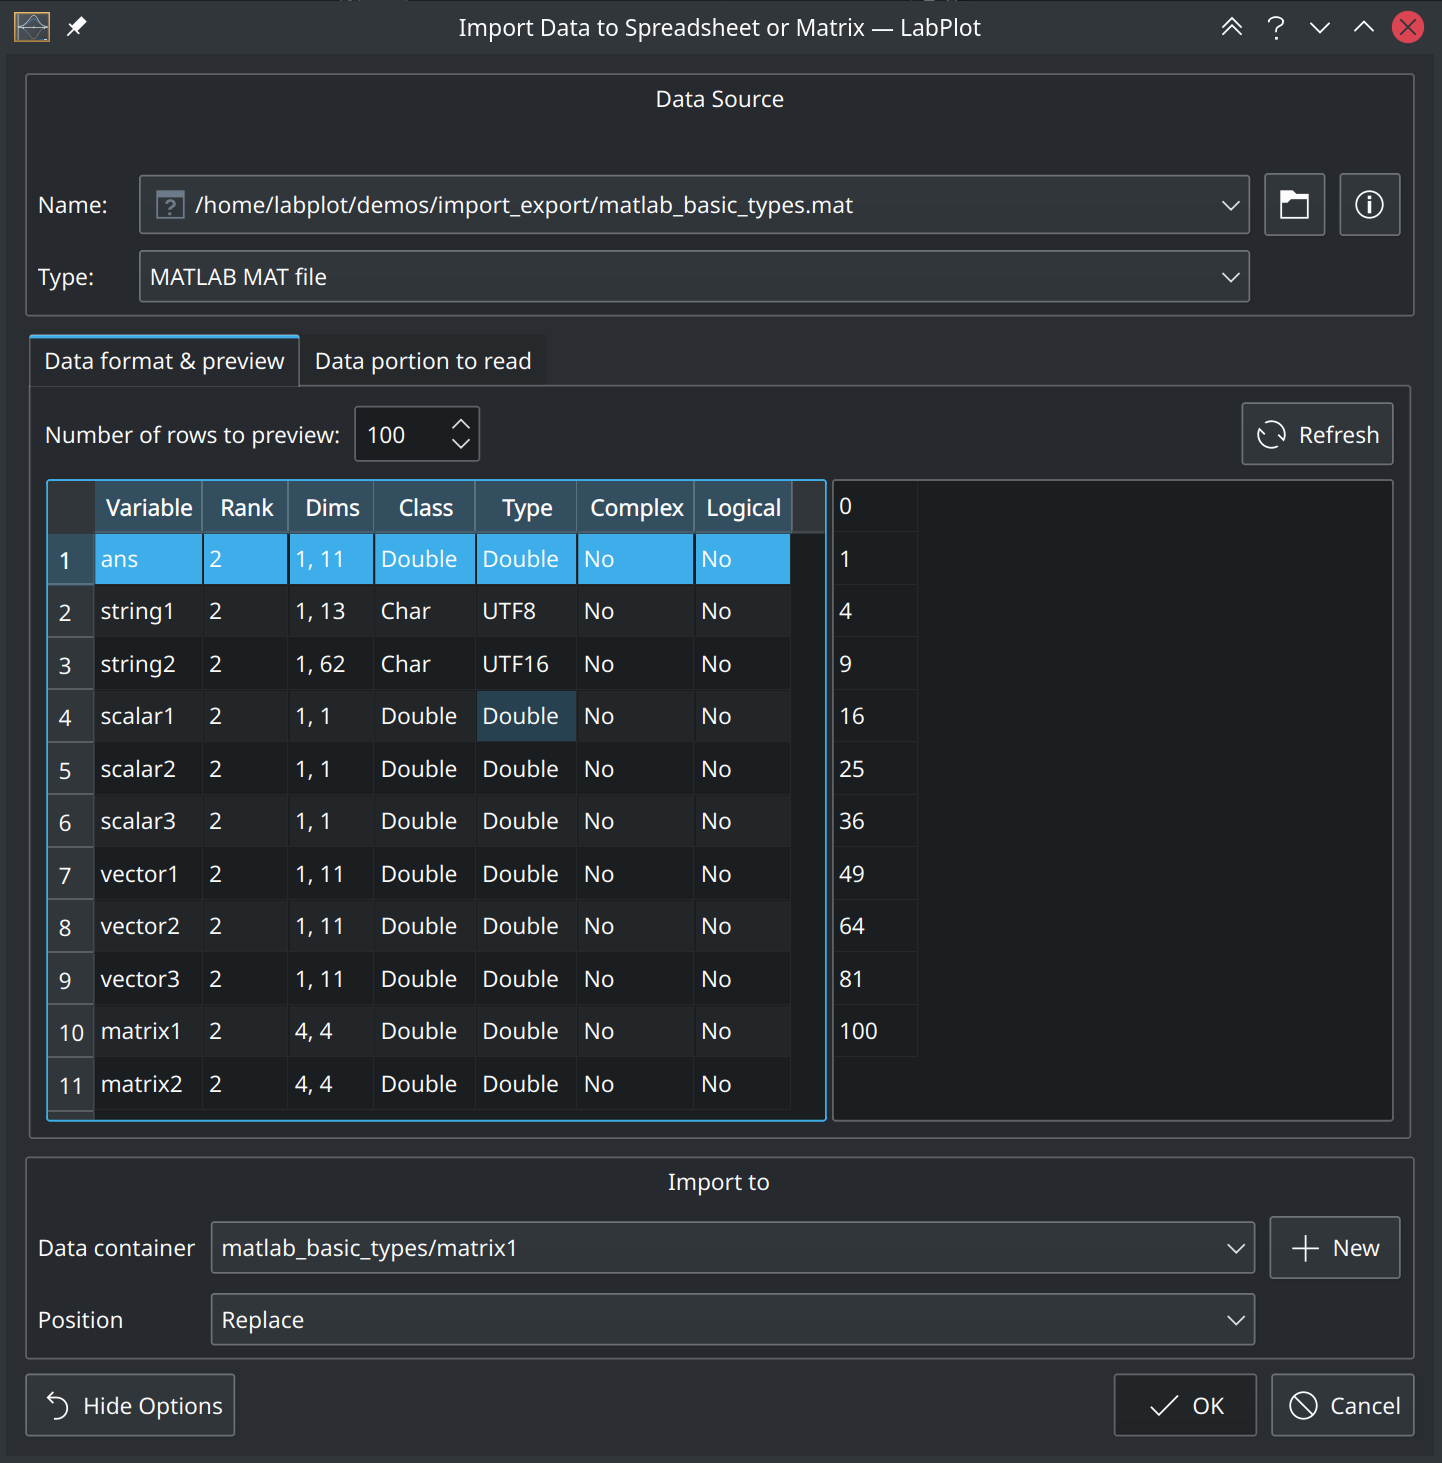
MATLAB is a commercial and proprietary numeric programming language and computing environment with a used widely in academia and industry. With the help of the MATIO open source library, we’re adding the support for MATLAB’s mat files (version 4 to 7.4). Similar to other already supported file formats, the import is done via LabPlot’s import file dialog where you can check the structure of the file, preview the data and specify which portion of it to import:

People doing statistical analysis will be familiar with software packages like SPSS, SAS and Stata. Many other open and closed source statistical packages were influenced by the success and by the feature set of these packages. The native file formats of these packages are widely used in the scientific community and supported by many tools. In the coming release we will be adding the support for SAS (SAS7BDAT, XPORT), Stata (DTA) and SPSS (PORT, SAV, ZSAV) file formats. For this, we also utilize an open-source library (ReadStat) covering all these formats and providing a consistent interface to them. The support for these file formats in the coming release of LabPlot is one of the steps towards strongly extending our user base by covering more of the workflows relevant in statistical analysis (see this recent blog post on the matter).
As usual, we invite our users to try out our nighly builds and to provide us feedback on these new features
RData would be cool
yes, definitely! It’s already on our todo-list.