LabPlot 2.4 released
We are happy to announce the next release of LabPlot!
The concise list of changes is available in the changelog. In the following we describe the most important new features in more details.
Beginning with the previous release, LabPlot is available for the Windows platform. Now we further extend the support for different operating systems and starting with this release LabPlot will be available for Mac OS X, too. We’re providing a Mac OS X bundle in our download section.
This is the very first release for Mac OS X and we consider it “experimental”. More time and polishing will be invested into this in future but we want to share this already now and to collect some feedback.
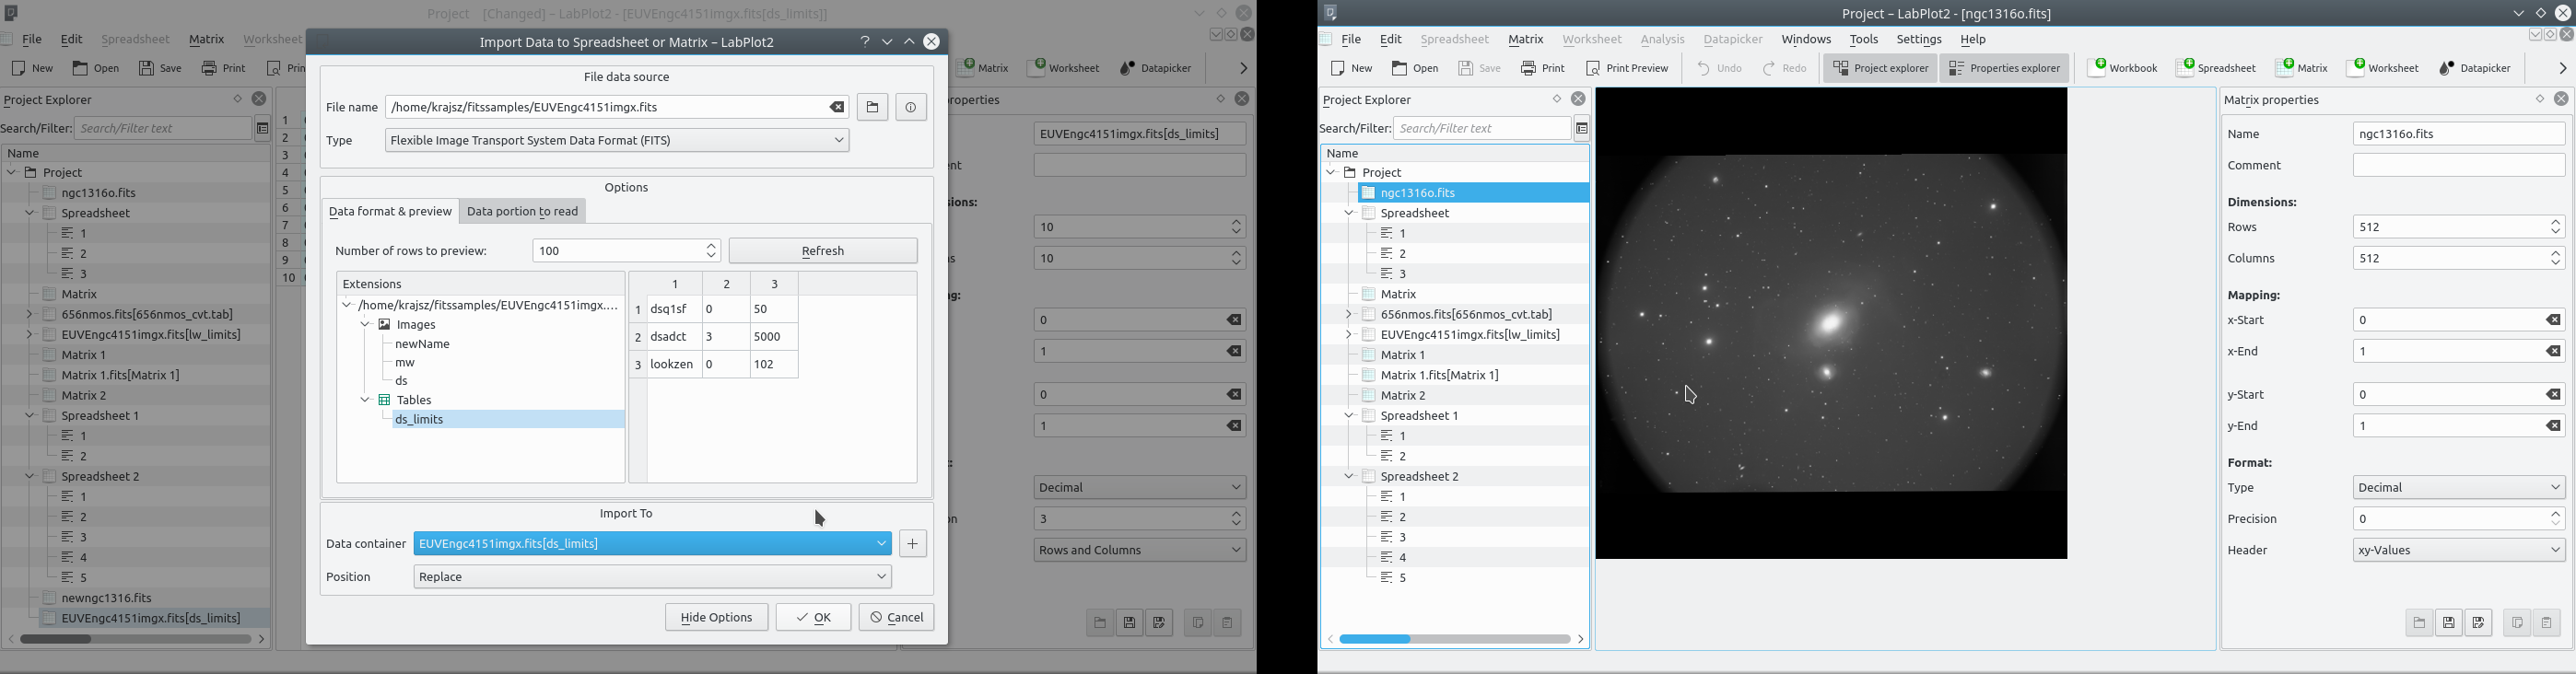
Two major contributions to this release were done during the “Google Summer of Code 2016” program last summer. Fábián Kristóf added the support for the FITS format. FITS is an open standard file format widely used in the scientific community to store structured as well as unstructured multi-dimensional data. It is now possible to import different data units stored in a FITS file into LabPlot’s data containers. The screenshot below shows the import dialog with a FITS file and a two-dimensional data array imported into the matrix container and the image preview of it:
One of the major features of the FITS format is the ability to store the metadata in human-readable headers. Such headers are stored in the file, in addition to the actual data, as key-value pairs in the ASCII format and provide additional information about the origin of the data, its size, used measurement devices, etc. Fábián implemented the tool FITS Metadata Editor that allows to inspect and to modify the metadata. This editor parses the metadata part of the selected FITS file only and shows all available headers in a tree view. Already existing key-value pairs can be modified or deleted, new pairs can be added. It is also possible to open and to edit more then one file at the same time.
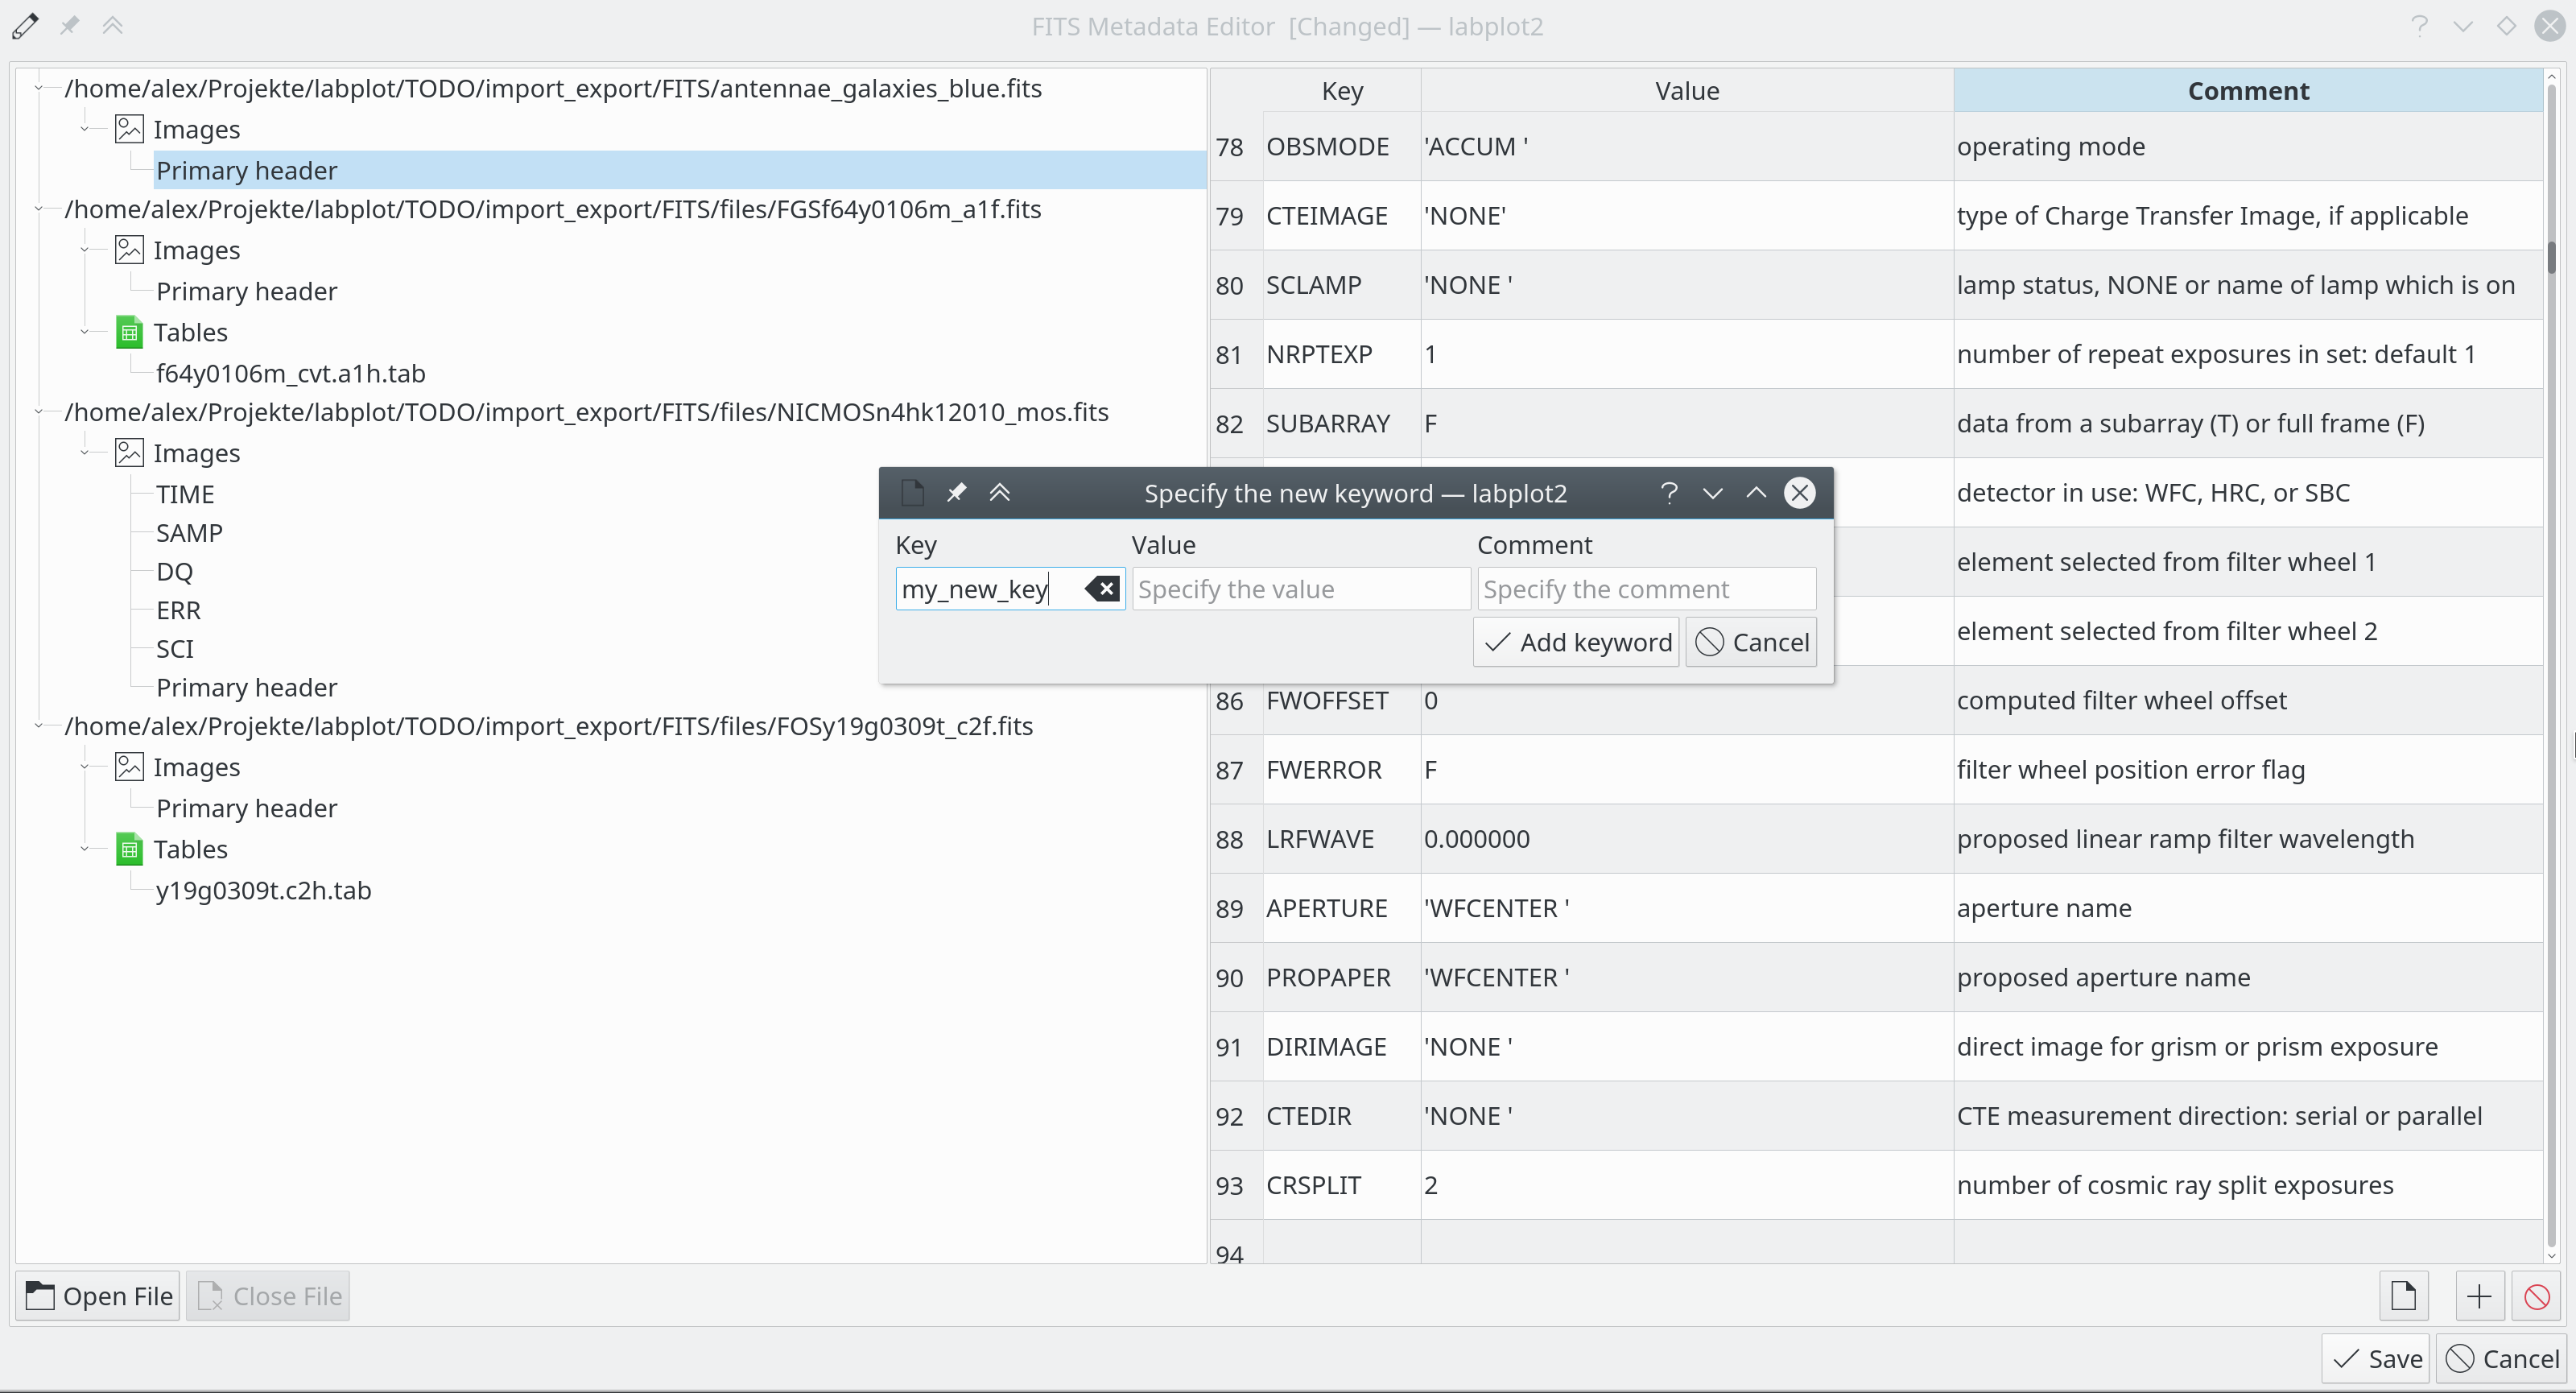
More screenshots are available in Fábián’s blog.
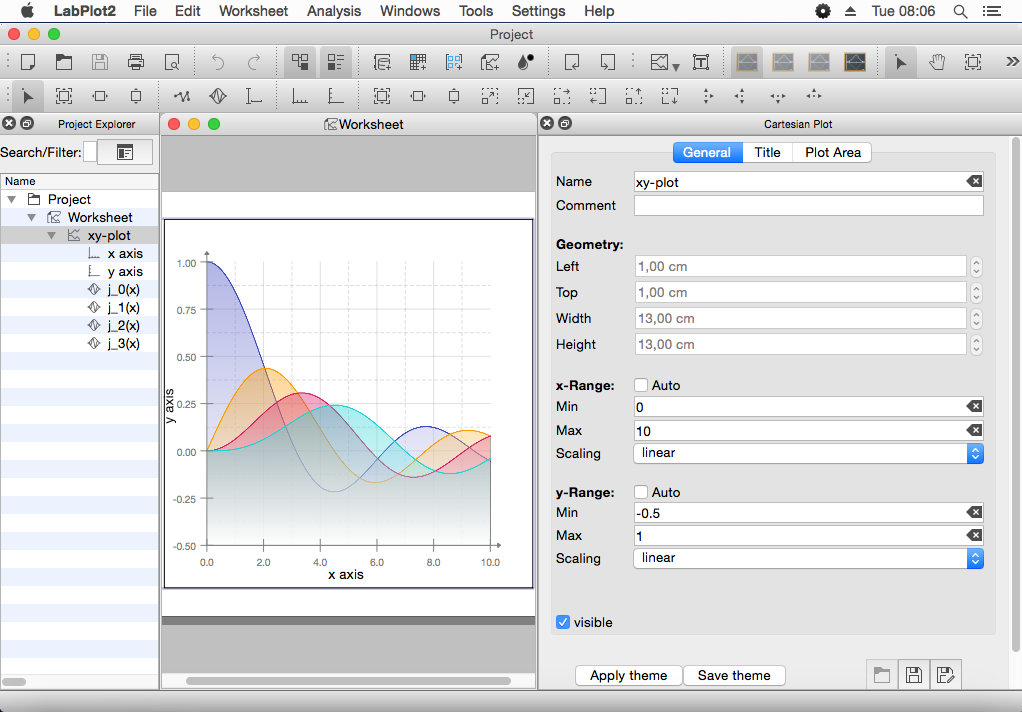
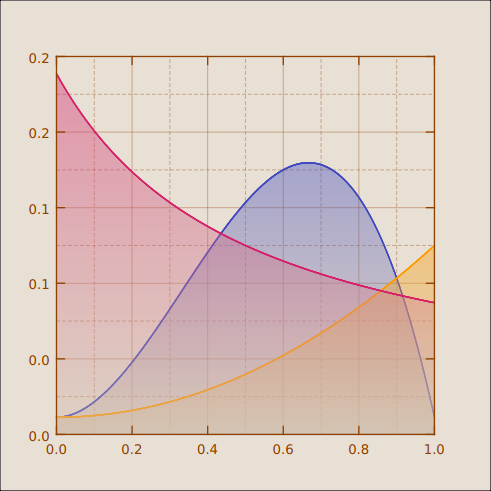
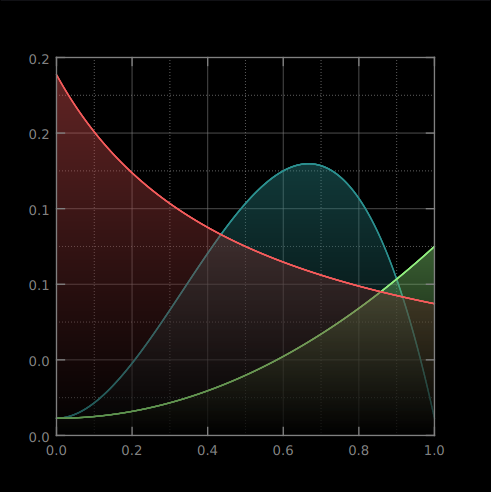
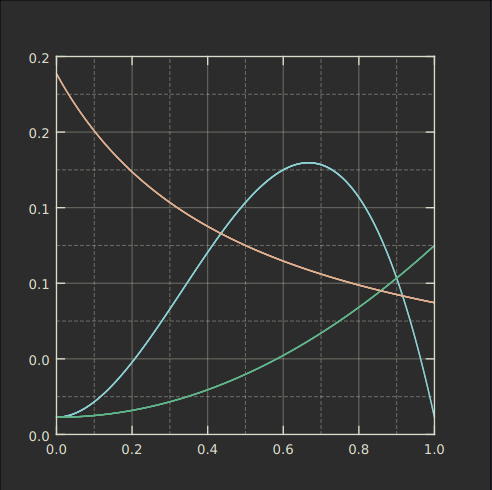
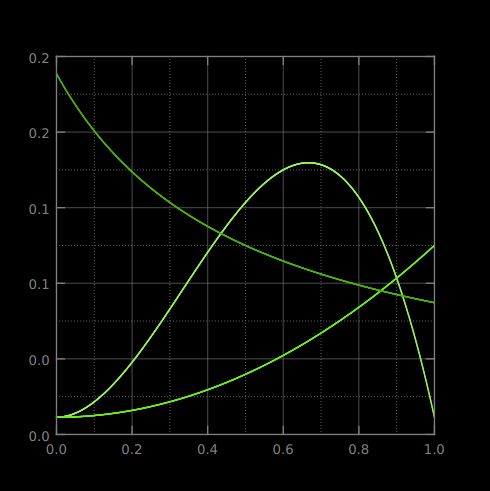
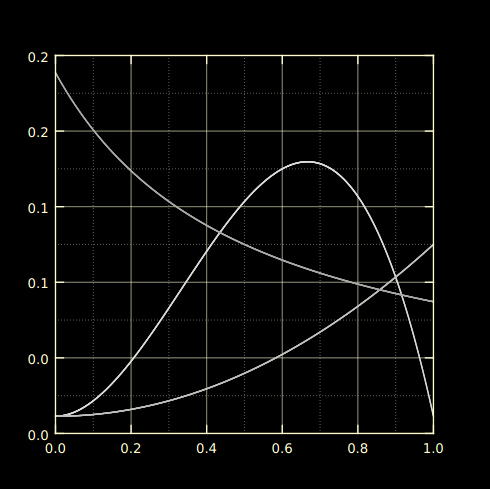
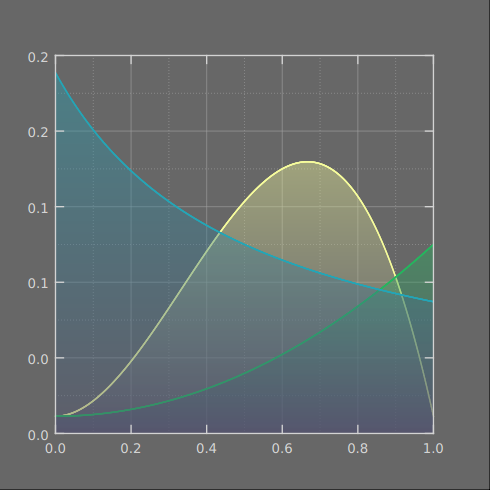
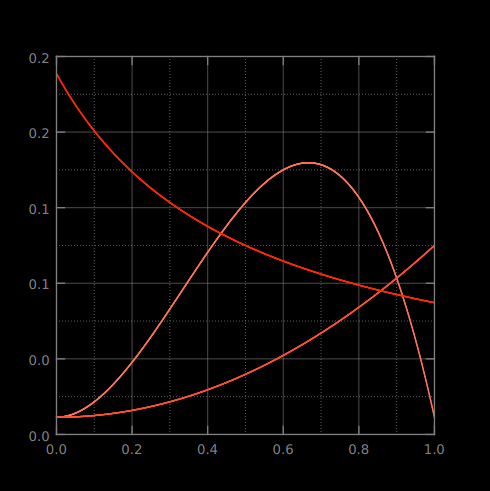
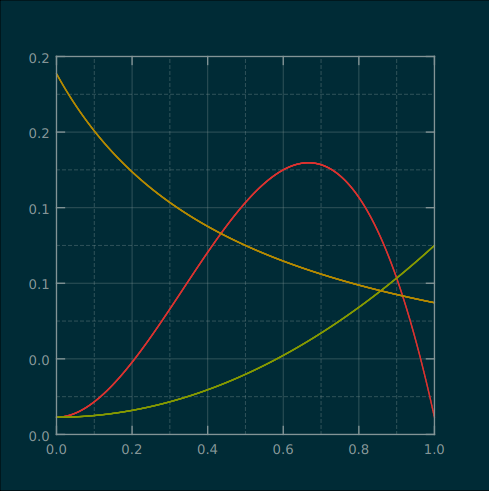
Prakriti Bhardwaj worked during GSoC2016 (blog ) on the Theme Manager for LabPlot which allows the user to quickly change the appearance of a plot and of all its curves. This selection together with the theme previews is available in the properties widget and in the context menu of the plot:
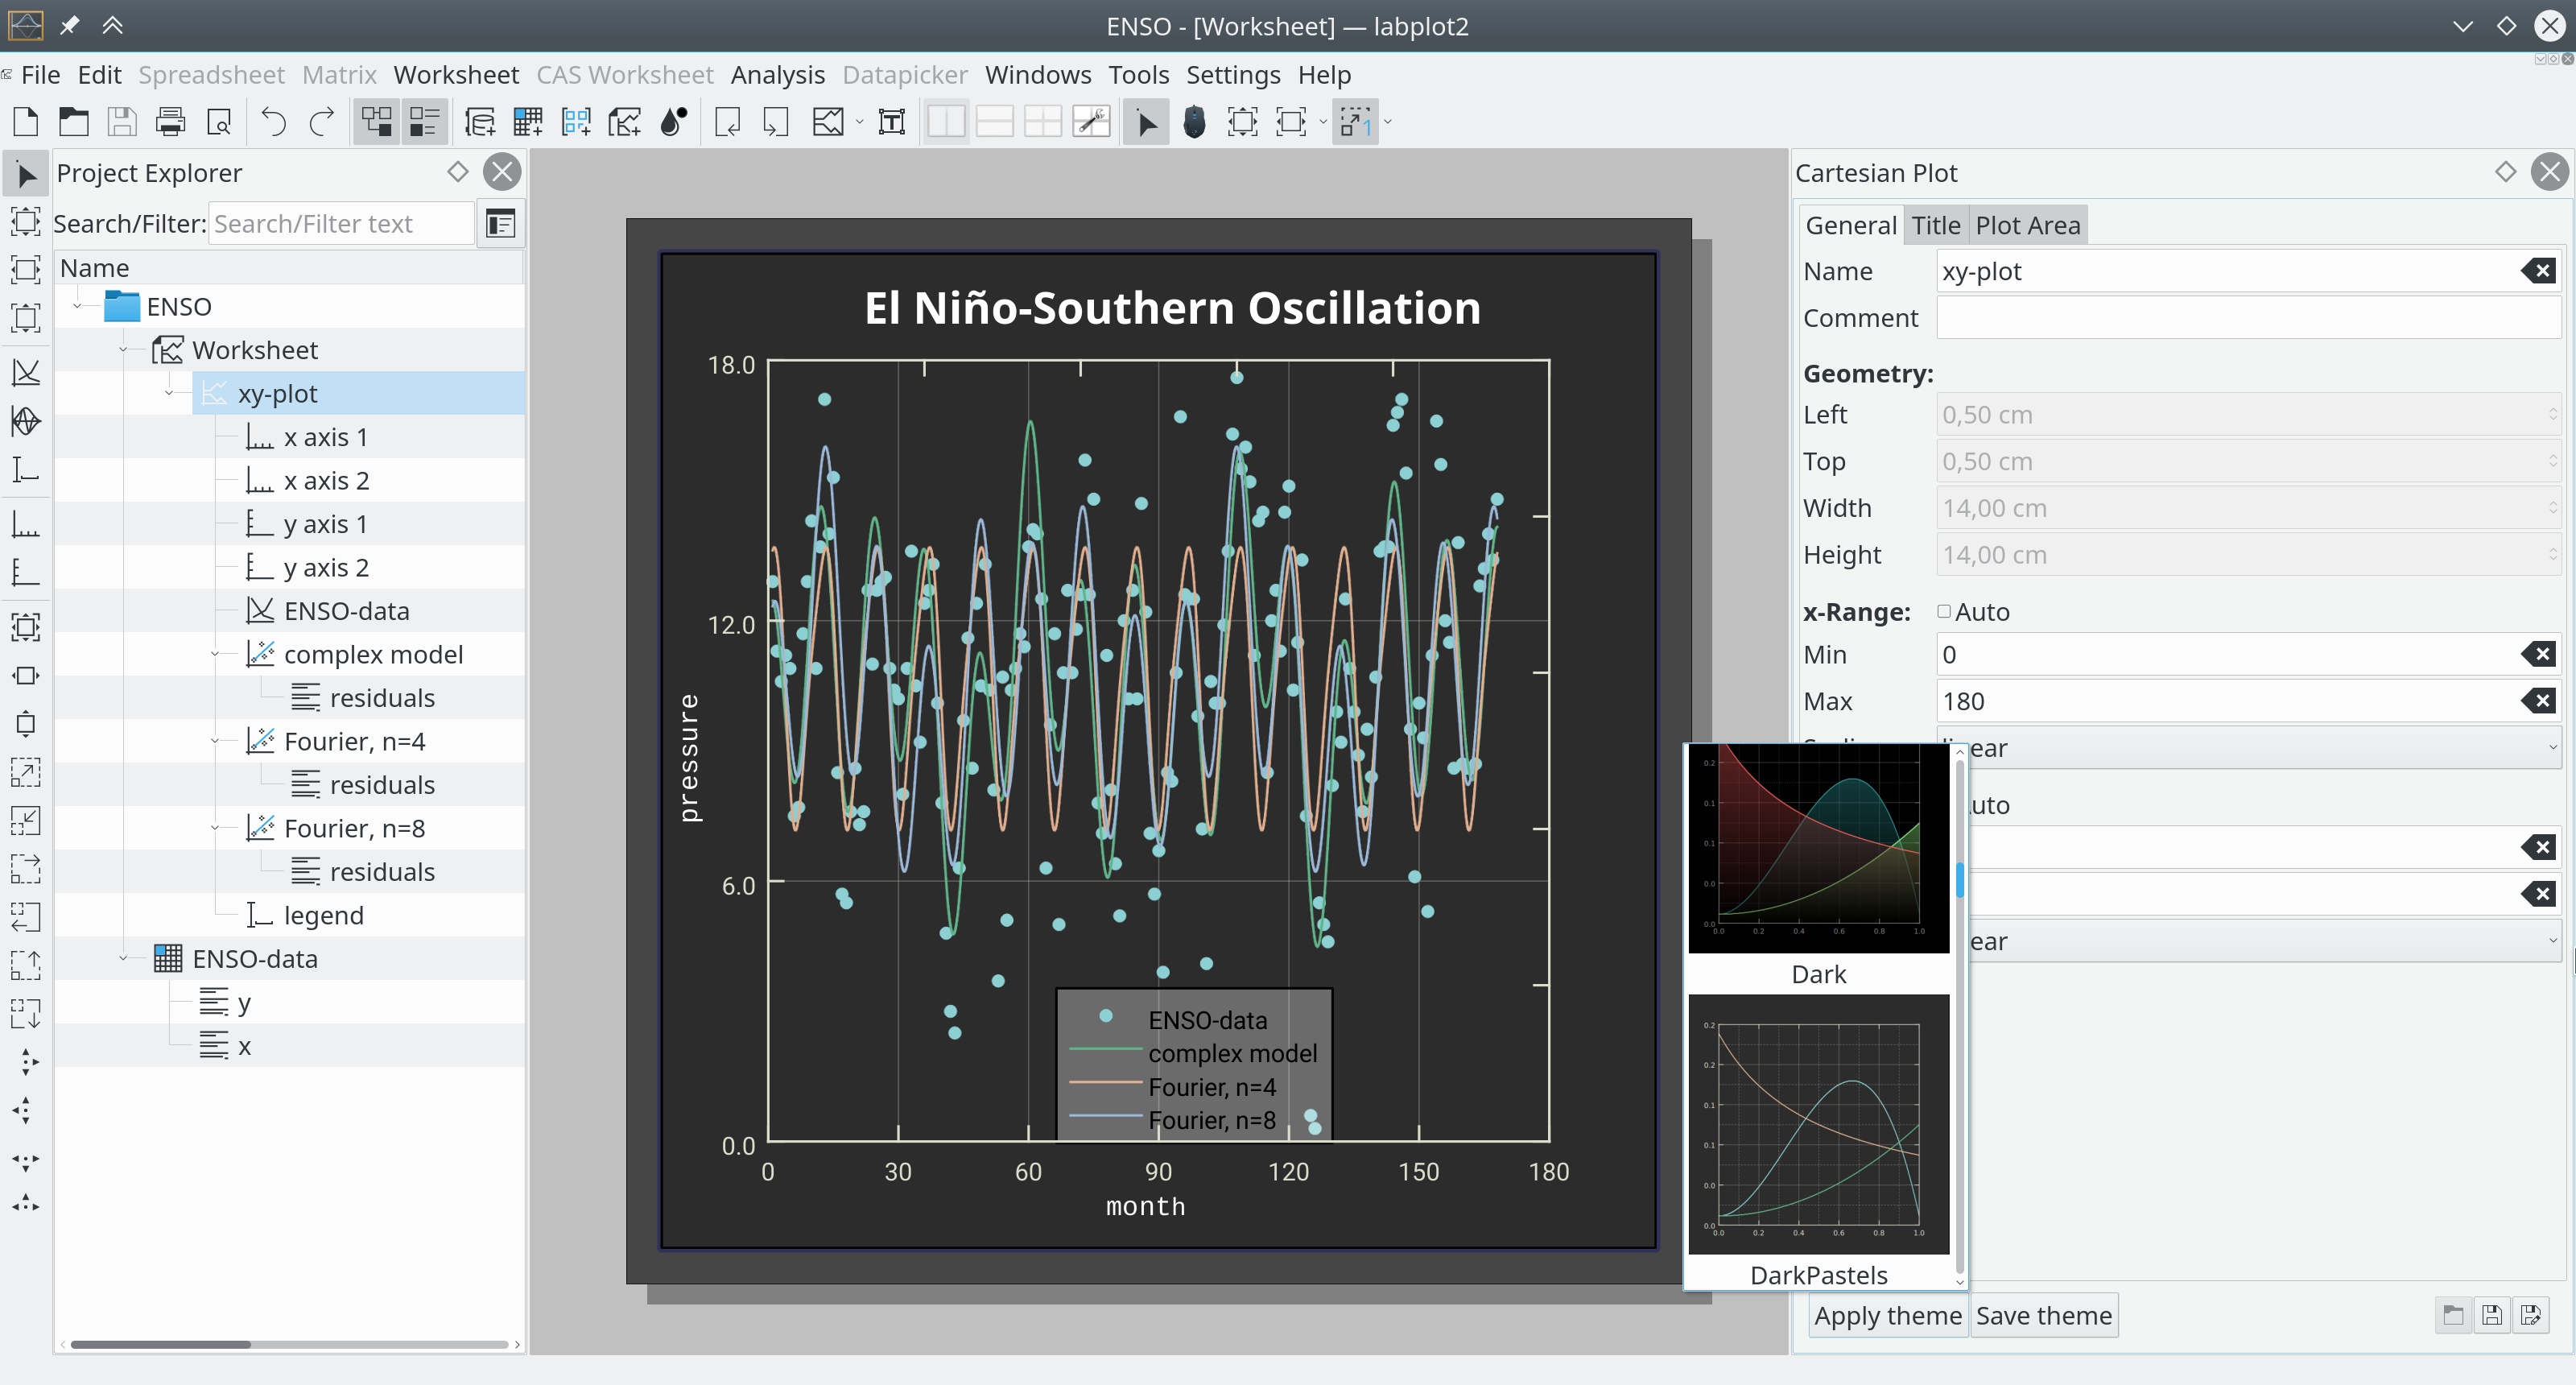
There are 13 different themes available at the moment:
We continue to work on the support for different computer algebra systems via Cantor. In this release the support for Julia vectors and tuples in CAS worksheets (requires Cantor v. 16.12 or higher) was added. Thanks to the work done by Ivan Lakhtanov during GSoC2016 who added Julia backend to Cantor (check Ivan’s blog), it was an easy task to add Julia to LabPlot.
Similar to the previous release, we invested a lot of time into the data analysis functionality in LabPlot. The already available capabilities for data fitting were extended – many new pre-defined fit models like Gompertz, Weibull, Log-Normal, Gumbel distributions, etc. were added. The available fit-models are now grouped thematically in categories and a LaTeX-rendered preview of the mathematical function is shown for each pre-defined fit model.
To have more influence on the fit procedure, the fit parameters can be fixed now or constrained by some boundary conditions (lower and/or upper limits).
New algorithms for data reduction were added. These algorithms allow to greatly reduce the number of points in the curve to be considered without changing the appearance of the curve to much. There’re many algorithms known to achieve this and we implemented couple of them like Douglas-Peucker, Reumann-Witkam, etc.
To further close the gaps to LabPlot1.x (and other similar projects), numerical differentiation (up to the 6th order) and numerical integration (rectangular, trapezoid and Simpson methods) were implemented. Similar to other analysis functions, the user can control these new functions via different parameters and options.
Support for LaTex-typesetting in LabPlot was strongly extended. LabPlot allows now to enter complete LaTeX documents everywhere where LaTex-syntax is supported (text label on the worksheet, plot title, etc.). With this, the user can now use documents with specific header and numerous packages for LaTex.
In LabPlot 2.4 there is new configuration parameter which allows to use different LaTex engines (LuaLaTex, XeLatex, pdfLaTex, LaTex) – the user can decide which rendering path to use and can e.g. select XeLatex to use Unicode in LaTex.
Also, there is a runtime check now in the application to disable LaTeX typesetting if no LaTex installation and other required tools are found on the system.
Among other smaller new features (check the changelog to see the full list of changes) we want to mention the new presenter mode for worksheets which shows the worksheet in the full-screen mode:
[…] LabPlot 2.4 released […]
If the LabPlot (window Version) be available, please let me know how I can download and install it.
regards,
The link to the windows installer can be found on our download page.